Public Storage 2007 Annual Report Download - page 6
Download and view the complete annual report
Please find page 6 of the 2007 Public Storage annual report below. You can navigate through the pages in the report by either clicking on the pages listed below, or by using the keyword search tool below to find specific information within the annual report.-
 1
1 -
 2
2 -
 3
3 -
 4
4 -
 5
5 -
 6
6 -
 7
7 -
 8
8 -
 9
9 -
 10
10 -
 11
11 -
 12
12 -
 13
13 -
 14
14 -
 15
15 -
 16
16 -
 17
17 -
18
-
19
-
20
-
21
-
22
-
23
-
24
-
25
-
26
-
27
-
28
-
29
-
30
-
31
-
32
-
33
-
34
-
35
-
36
-
37
-
38
-
39
-
40
-
41
-
42
-
43
-
44
-
45
-
46
-
47
-
48
-
49
-
50
-
51
-
52
-
53
-
54
-
55
-
56
-
57
-
58
-
59
-
60
-
61
-
62
-
63
-
64
-
65
-
66
-
67
-
68
-
69
-
70
-
71
-
72
-
73
-
74
-
75
-
76
-
77
-
78
-
79
-
80
-
81
-
82
-
83
-
84
-
85
-
86
-
87
-
88
-
89
-
90
-
91
-
92
-
93
-
94
-
95
-
96
-
97
-
98
-
99
-
100
-
101
-
102
-
103
-
104
-
105
-
106
-
107
-
108
-
109
-
110
-
111
-
112
-
113
-
114
-
115
-
116
-
117
-
118
-
119
-
120
-
121
-
122
-
123
-
124
-
125
-
126
-
127
-
128
-
129
-
130
-
131
-
132
-
133
-
134
-
135
-
136
-
137
-
138
-
139
-
140
-
141
-
142
-
143
-
144
-
145
-
146
-
147
-
148
-
149
-
150
-
151
-
152
-
153
-
154
-
155
-
156
 |
 |

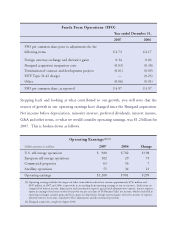
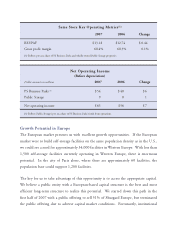
Funds From Operations (FFO)
Year ended December 31,
2007 2006
FFO per common share prior to adjustments for the
following items $ 4.73 $ 4.17
Foreign currency exchange and derivative gains 0.34 0.03
Shurgard acquisition integration costs (0.03) (0.30)
Termination of contract and development projects (0.01) (0.09)
EITF Topic D-42 charges — (0.23)
Other (0.06) (0.01)
FFO per common share, as reported $ 4.97 $ 3.57
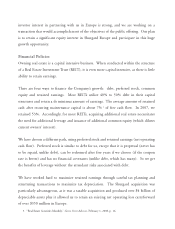
Stepping back and looking at what contributed to our growth, you will note that the
sources of growth in our operating earnings have changed since the Shurgard acquisition.
Net income before depreciation, minority interest, preferred dividends, interest income,
G&A and other items, or what we would consider operating earnings, was $1.2 billion for
2007. This is broken down as follows.
Operating Earnings(1)(2)
Dollar amounts in millions 2007 2006 Change
U.S. self-storage operations $ 980 $ 782 $ 198
European self-storage operations 102 29 73
Commercial properties 63 56 7
Ancillary operations 55 34 21
Operating earnings $1,200 $ 901 $ 299
(1) Operating earnings excludes the impact of other items which reduced net income approximately $743 million and
$587 million in 2007 and 2006, respectively, in reconciling from operating earnings to our net income. Such items are
comprised of interest income, depreciation and amortization expense, general and administrative expense, interest expense,
equity in earnings of real estate entities (except for our pro rata share of PS Business Parks’ net income, which is included in
operating earnings), casualty gains and losses, gains on disposition, foreign currency gains, derivative income or expense,
minority interest in income, cumulative effect adjustments and discontinued operations.
(2) Shurgard acquisition completed August 2006.