Public Storage 2007 Annual Report Download - page 3
Download and view the complete annual report
Please find page 3 of the 2007 Public Storage annual report below. You can navigate through the pages in the report by either clicking on the pages listed below, or by using the keyword search tool below to find specific information within the annual report.-
 1
1 -
 2
2 -
 3
3 -
 4
4 -
 5
5 -
 6
6 -
 7
7 -
 8
8 -
 9
9 -
 10
10 -
 11
11 -
 12
12 -
 13
13 -
 14
14 -
15
-
16
-
17
-
18
-
19
-
20
-
21
-
22
-
23
-
24
-
25
-
26
-
27
-
28
-
29
-
30
-
31
-
32
-
33
-
34
-
35
-
36
-
37
-
38
-
39
-
40
-
41
-
42
-
43
-
44
-
45
-
46
-
47
-
48
-
49
-
50
-
51
-
52
-
53
-
54
-
55
-
56
-
57
-
58
-
59
-
60
-
61
-
62
-
63
-
64
-
65
-
66
-
67
-
68
-
69
-
70
-
71
-
72
-
73
-
74
-
75
-
76
-
77
-
78
-
79
-
80
-
81
-
82
-
83
-
84
-
85
-
86
-
87
-
88
-
89
-
90
-
91
-
92
-
93
-
94
-
95
-
96
-
97
-
98
-
99
-
100
-
101
-
102
-
103
-
104
-
105
-
106
-
107
-
108
-
109
-
110
-
111
-
112
-
113
-
114
-
115
-
116
-
117
-
118
-
119
-
120
-
121
-
122
-
123
-
124
-
125
-
126
-
127
-
128
-
129
-
130
-
131
-
132
-
133
-
134
-
135
-
136
-
137
-
138
-
139
-
140
-
141
-
142
-
143
-
144
-
145
-
146
-
147
-
148
-
149
-
150
-
151
-
152
-
153
-
154
-
155
-
156
 |
 |

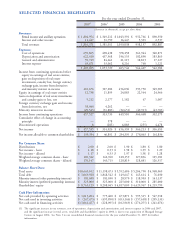
For the year ended December 31,
2007 12006 12005 2004 2003
(Amounts in thousands, except per share data)
Revenues:
Rental income and ancillary operations $ 1,804,954 $ 1,349,212 $ 1,043,391 $ 952,766 $ 890,350
Interest and other income 11,417 31,799 16,447 5,391 2,537
Total revenues 1,816,371 1,381,011 1,059,838 958,157 892,887
Expenses:
Cost of operations 659,865 498,438 378,258 361,944 340,871
Depreciation and amortization 622,410 437,568 196,153 182,890 183,863
General and administrative 59,749 84,661 21,115 18,813 17,127
Interest expense 63,671 33,062 8,216 760 1,121
1,405,695 1,053,729 603,742 564,407 542,982
Income from continuing operations before
equity in earnings of real estate entities,
gain on disposition of real estate
investments, casualty loss, foreign currency
exchange gain, income from derivatives
and minority interest in income 410,676 327,282 456,096 393,750 349,905
Equity in earnings of real estate entities 12,738 11,895 24,883 22,564 24,966
Gain on disposition of real estate investments
and casualty gain or loss, net 5,212 2,177 1,182 67 1,007
Foreign currency exchange gain and income
from derivatives, net 58,444 4,262 — — —
Minority interest in income (29,543) (31,883) (32,651) (49,913) (43,703)
Income from continuing operations 457,527 313,733 449,510 366,468 332,175
Cumulative effect of change in accounting
principle — 578 — — —
Discontinued operations 8 (285) 6,883 (255) 4,478
Net income $ 457,535 $ 314,026 $ 456,393 $ 366,213 $ 336,653
Net income allocable to common shareholders $ 199,354 $ 46,891 $ 254,395 $ 178,063 $ 161,836
Per Common Share:
Distributions $ 2.00 $ 2.00 $ 1.90 $ 1.80 $ 1.80
Net income - basic $ 1.18 $ 0.33 $ 1.98 $ 1.39 $ 1.29
Net income - diluted $ 1.17 $ 0.33 $ 1.97 $ 1.38 $ 1.28
Weighted average common shares - basic 169,342 142,760 128,159 127,836 125,181
Weighted average common shares - diluted 170,147 143,715 128,819 128,681 126,517
Balance Sheet Data:
Total assets $10,643,102 $11,198,473 $ 5,552,486 $ 5,204,790 $ 4,968,069
Total debt $ 1,069,928 $ 1,848,542 $ 149,647 $ 145,614 $ 76,030
Minority interest (other partnership interests) $ 181,688 $ 181,030 $ 28,970 $ 118,903 $ 141,137
Minority interest (preferred partnership interests) $ 325,000 $ 325,000 $ 225,000 $ 310,000 $ 285,000
Shareholders’ equity $ 8,763,129 $ 8,208,045 $ 4,817,009 $ 4,429,967 $ 4,219,799
Cash Flow Information:
Net cash provided by operating activities $ 1,013,204 $ 775,400 $ 673,871 $ 595,315 $ 547,918
Net cash used in investing activities $ (247,475) $ (495,890) $ (453,146) $ (157,638) $ (205,133)
Net cash used in financing activities $ (1,061,457) $ (228,095) $ (102,969) $ (276,255) $ (241,076)
SELECTED FINANCIAL HIGHLIGHTS
(1) The significant increase in our revenues, cost of operations, depreciation and amortization, and interest expense in 2006 and 2007,
and the significant increase in total assets, total debt and shareholders’ equity in 2006, is due to our acquisition of Shurgard Storage
Centers in August 2006. See Note 3 to our consolidated financial statements for the year ended December 31, 2007 for further
information.