Public Storage 2003 Annual Report Download - page 5
Download and view the complete annual report
Please find page 5 of the 2003 Public Storage annual report below. You can navigate through the pages in the report by either clicking on the pages listed below, or by using the keyword search tool below to find specific information within the annual report.-
 1
1 -
 2
2 -
 3
3 -
 4
4 -
 5
5 -
 6
6 -
 7
7 -
 8
8 -
 9
9 -
 10
10 -
 11
11 -
 12
12 -
 13
13 -
 14
14 -
 15
15 -
 16
16 -
17
-
18
-
19
-
20
-
21
-
22
-
23
-
24
-
25
-
26
-
27
-
28
-
29
-
30
-
31
-
32
-
33
-
34
-
35
-
36
-
37
-
38
-
39
-
40
-
41
-
42
-
43
-
44
-
45
-
46
-
47
-
48
-
49
-
50
-
51
-
52
-
53
-
54
-
55
-
56
-
57
-
58
-
59
-
60
-
61
-
62
-
63
-
64
-
65
-
66
-
67
-
68
-
69
-
70
-
71
-
72
-
73
-
74
-
75
-
76
-
77
-
78
-
79
-
80
-
81
-
82
-
83
-
84
-
85
-
86
-
87
-
88
-
89
-
90
-
91
-
92
-
93
-
94
-
95
-
96
-
97
-
98
-
99
-
100
-
101
-
102
-
103
-
104
-
105
-
106
-
107
-
108
-
109
-
110
-
111
-
112
-
113
-
114
-
115
-
116
-
117
-
118
-
119
-
120
-
121
-
122
-
123
-
124
-
125
-
126
-
127
-
128
-
129
-
130
-
131
-
132
-
133
-
134
-
135
-
136
-
137
-
138
-
139
-
140
-
141
-
142
-
143
-
144
-
145
-
146
-
147
-
148
-
149
-
150
-
151
-
152
-
153
-
154
-
155
-
156
-
157
-
158
-
159
-
160
-
161
-
162
-
163
-
164
-
165
-
166
-
167
-
168
-
169
 |
 |

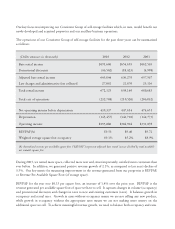
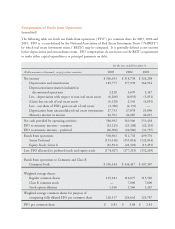
Our key focus was improving our Consistent Group of self-storage facilities which, in turn, would benefit our
newly developed and acquired properties and our ancillary business operations.
The operations of our Consistent Group of self-storage facilities for the past three years can be summarized
as follows:
(Dollar amounts in thousands) 2003 2002 2001
Base rental income $691,606 $654,693 $662,565
Promotional discounts (46,562) (18,423) (4,998)
Adjusted base rental income 645,044 636,270 657,567
Late charges and administrative fees collected 27,081 21,870 23,116
Total rental income 672,125 658,140 680,683
Total cost of operations (232,788) (210,526) (206,032)
Net operating income before depreciation 439,337 447,614 474,651
Depreciation (145,457) (142,710) (142,773)
Operating income $293,880 $304,904 $331,878
REVPAF(A) $9.53 $9.40 $9.72
Weighted average square foot occupancy 89.1% 85.2% 88.9%
(A) Annualized revenue per available square foot (REVPAF) represents adjusted base rental income divided by total available
net rentable square feet.
During 2003, we rented more space, collected more rent and, most importantly, satisfied more customers than
ever before. In addition, we generated positive revenue growth of 2.1%, as compared to last years decline of
3.3%. Our key metric for measuring improvement in the revenue generated from our properties is REVPAF,
or Revenue Per Available Square Foot (of storage space).
REVPAF for the year rose $0.13 per square foot, an increase of 1.4% over the prior year. REVPAF is the
revenue generated per available square foot of space we have to sell. It captures changes in volume (occupancy)
and promotional discounts and changes in rates to new and existing customers (rates). It balances growth in
occupancy and rental rates. Growth in rates without occupancy means we are not selling any new product,
while growth in occupancy without the appropriate rates means we are not making more money on the
additional space we sell. To achieve meaningful revenue growth, we need to balance both occupancy and rates.