Public Storage 2003 Annual Report Download - page 3
Download and view the complete annual report
Please find page 3 of the 2003 Public Storage annual report below. You can navigate through the pages in the report by either clicking on the pages listed below, or by using the keyword search tool below to find specific information within the annual report.-
 1
1 -
 2
2 -
 3
3 -
 4
4 -
 5
5 -
 6
6 -
 7
7 -
 8
8 -
 9
9 -
 10
10 -
 11
11 -
 12
12 -
 13
13 -
 14
14 -
15
-
16
-
17
-
18
-
19
-
20
-
21
-
22
-
23
-
24
-
25
-
26
-
27
-
28
-
29
-
30
-
31
-
32
-
33
-
34
-
35
-
36
-
37
-
38
-
39
-
40
-
41
-
42
-
43
-
44
-
45
-
46
-
47
-
48
-
49
-
50
-
51
-
52
-
53
-
54
-
55
-
56
-
57
-
58
-
59
-
60
-
61
-
62
-
63
-
64
-
65
-
66
-
67
-
68
-
69
-
70
-
71
-
72
-
73
-
74
-
75
-
76
-
77
-
78
-
79
-
80
-
81
-
82
-
83
-
84
-
85
-
86
-
87
-
88
-
89
-
90
-
91
-
92
-
93
-
94
-
95
-
96
-
97
-
98
-
99
-
100
-
101
-
102
-
103
-
104
-
105
-
106
-
107
-
108
-
109
-
110
-
111
-
112
-
113
-
114
-
115
-
116
-
117
-
118
-
119
-
120
-
121
-
122
-
123
-
124
-
125
-
126
-
127
-
128
-
129
-
130
-
131
-
132
-
133
-
134
-
135
-
136
-
137
-
138
-
139
-
140
-
141
-
142
-
143
-
144
-
145
-
146
-
147
-
148
-
149
-
150
-
151
-
152
-
153
-
154
-
155
-
156
-
157
-
158
-
159
-
160
-
161
-
162
-
163
-
164
-
165
-
166
-
167
-
168
-
169
 |
 |

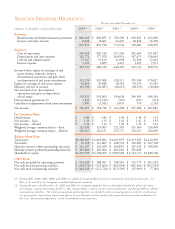
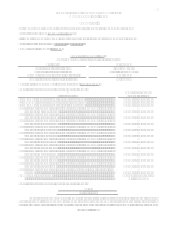
(Amounts in thousands, except per share data) 2003(1) 2002(1) 2001(1) 2000(1) 1999(1)
Revenues:
Rental income and tenant reinsurance premiums $ 866,443 $ 822,897 $ 760,309 $ 690,845 $ 622,299
Interest and other income 8,628 8,661 14,225 18,836 16,700
875,071 831,558 774,534 709,681 638,999
Expenses:
Cost of operations 318,498 287,144 257,244 241,669 211,847
Depreciation and amortization 185,775 177,978 164,914 147,473 136,663
General and administrative 17,127 15,619 21,038 21,306 12,491
Interest expense 1,121 3,809 3,227 3,293 7,971
522,521 484,550 446,423 413,741 368,972
Income before equity in earnings of real
estate entities, minority interest,
discontinued operations and gain (loss)
on disposition of real estate investments 352,550 347,008 328,111 295,940 270,027
Equity in earnings of real estate entities 24,966 29,888 38,542 39,319 32,183
Minority interest in income (43,703) (44,087) (46,015) (38,356) (16,006)
Net income before discontinued
operations and gain on disposition
of real estate 333,813 332,809 320,638 296,903 286,204
Discontinued operations (2) 1,833 (11,530) (521) (391) (473)
Gain/(loss) on disposition of real estate investments 1,007 (2,541) 4,091 576 2,154
Net income $ 336,653 $ 318,738 $ 324,208 $ 297,088 $ 287,885
Per Common Share:
Distributions $ 1.80 $ 1.80 $ 1.69 $ 1.48 $ 1.52
Net income basic $ 1.29 $ 1.15 $ 1.41 $ 1.41 $ 1.53
Net income diluted $ 1.28 $ 1.14 $ 1.39 $ 1.41 $ 1.52
Weighted average common shares basic 125,181 123,005 122,310 131,566 126,308
Weighted average common shares diluted 126,517 124,571 123,577 131,657 126,669
Balance Sheet Data:
Total assets $4,968,069 $ 4,843,662 $ 4,625,879 $ 4,513,941 $4,214,385
Total debt $ 76,030 $ 115,867 $ 168,552 $ 156,003 $ 167,338
Minority interest (other partnership interests) $ 141,137 $ 154,499 $ 169,601 $ 167,918 $ 186,600
Minority interest (preferred partnership interests) $ 285,000 $ 285,000 $ 285,000 $ 365,000 -
Shareholders equity $4,219,799 $ 4,158,969 $ 3,909,583 $ 3,724,117 $3,689,100
Other Data:
Net cash provided by operating activities $ 594,430 $ 588,961 $ 538,534 $ 525,775 $ 463,292
Net cash used in investing activities $ (228,176) $ (323,464) $ (306,058) $ (465,464) $ (452,209)
Net cash used in financing activities $ (264,545) $ (211,720) $ (272,596) $ (25,969) $ (7,183)
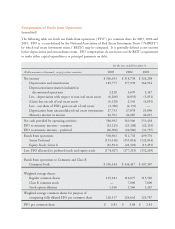
(1) During 2003, 2002, 2001, 2000, and 1999, we completed several significant business combinations and equity transactions. See
Notes 3, 9, and 10 to the Companys consolidated financial statements.
(2) During the years ended December 31, 2002 and 2003, the Company adopted a business plan that included the closure of certain
non-strategic containerized storage facilities. Also, during 2002 we sold one of our commercial facilities and during 2003 we sold five
miniwarehouse facilities. The historical operations of these facilities are classified as discontinued operations, with the rental income,
cost of operations, depreciation expense and gain or loss on disposition of these facilities for current and prior periods included in the
line-item Discontinued Operations on the consolidated income statement.
SELECTED FINANCIAL HIGHLIGHTS
For the year ended December 31,