Pitney Bowes 2003 Annual Report Download - page 31
Download and view the complete annual report
Please find page 31 of the 2003 Pitney Bowes annual report below. You can navigate through the pages in the report by either clicking on the pages listed below, or by using the keyword search tool below to find specific information within the annual report.-
 1
1 -
2
-
3
-
4
-
5
-
6
-
7
-
8
-
9
-
10
-
11
-
12
-
13
-
14
-
15
-
16
-
17
-
18
-
19
-
20
-
 21
21 -
 22
22 -
 23
23 -
 24
24 -
 25
25 -
 26
26 -
 27
27 -
 28
28 -
 29
29 -
 30
30 -
 31
31 -
 32
32 -
 33
33 -
 34
34 -
 35
35 -
 36
36
 |
 |

29
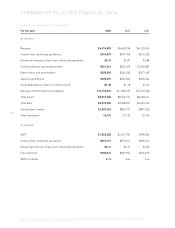
RECONCILIATION OF REPORTED CONSOLIDATED
RESULTS TO ADJUSTED RESULTS
Dollars in thousands, except per share amounts
For the year 2003 2002 2001
GAAP income from continuing operations
before income taxes, as reported $721,091 $619,445 $766,384
Capital services charges –213,182 –
Contributions to charitable foundations 10,000 ––
Legal settlements, net (10,117) – (338,097)
Restructuring charges 116,713 – 116,142
Cost of meter transition –– 268,300
Income from continuing operations
before income taxes, as adjusted 837,687 832,627 812,729
Provision for income taxes, as adjusted 268,216 260,616 256,455
Income from continuing operations, as adjusted 569,471 572,011 556,274
Interest expense, net 164,941 179,154 184,173
Provision for income taxes, as adjusted 268,216 260,616 256,455
EBIT $1,002,628 $1,011,781 $996,902
GAAP diluted earnings per share, as reported $2.11 $1.97 $1.97
Income from discontinued operations (0.01) (0.16) 0.10
GAAP diluted earnings per share from continuing
operations, as reported $2.10 $1.81 $2.08
Capital services charges –0.56 –
Contributions to charitable foundations 0.03 ––
Legal settlements, net (0.03) – (0.82)
Restructuring charges 0.32 – 0.30
Cost of meter transition –– 0.68
Diluted earnings per share from continuing
operations, as adjusted $2.41 $2.37 $2.25
GAAP net cash provided by operating activities,
as reported $851,261 $502,559 $1,035,887
Capital expenditures (285,681) (224,834) (256,204)
Free cash flow 565,580 277,725 779,683
Pension plan investment 50,000 338,579 30,000
Contributions related to charitable foundations 10,000 – –
Payments related to restructuring charges 62,751 49,032 49,065
Payments related to legal settlements, net –11,856 (243,391)
Spin-off of Imagistics International Inc. –4,772 31,253
Free cash flow, as adjusted $688,331 $681,964 $646,610
The sum of the earnings per share amounts may not equal the totals above due to rounding.
Management believes this presentation provides a reasonable basis on which to present the adjusted financial information. The Company’s financial results
are reported in accordance with generally accepted accounting principles (GAAP). The earnings per share and free cash flow results are adjusted to exclude
the impact of special items such as restructuring charges and write downs of assets, which materially impact the comparability of the Company’s results of
operations. The use of free cash flow has limitations. GAAP cash flow has the advantage of including all cash available to the company after actual expenditures
for all purposes. Free cash flow is the amount of cash that management could have available for discretionary uses if it made different decisions about employing
its cash. It adds back long-term commitments such as capital expenditures and pension plan contributions, as well as special items such as charitable
contributions and cash used for restructuring charges. Each of these items use cash that is not otherwise available to the company and are important
expenditures. Management compensates for these limitations by using a combination of GAAP cash flow and free cash flow in doing its planning.
The adjusted financial information and certain financial measures such as EBIT and EBIT to interest are intended to be more indicative of the ongoing
operations and economic results of the Company. EBIT excludes interest and taxes, and as a result, has the effect of showing a greater amount of earnings
than net income. The Company believes that interest and taxes, though important, do not reflect management effectiveness as these items are largely outside
of their control. In assessing performance, the Company uses both EBIT and net income.
This adjusted financial information should not be construed as an alternative to our reported results determined in accordance with GAAP. Further,
our definition of this adjusted financial information may differ from similarly titled measures used by other companies.