Pitney Bowes 2003 Annual Report Download - page 30
Download and view the complete annual report
Please find page 30 of the 2003 Pitney Bowes annual report below. You can navigate through the pages in the report by either clicking on the pages listed below, or by using the keyword search tool below to find specific information within the annual report.-
 1
1 -
2
-
3
-
4
-
5
-
6
-
7
-
8
-
9
-
10
-
11
-
12
-
13
-
14
-
15
-
16
-
17
-
18
-
19
-
 20
20 -
 21
21 -
 22
22 -
 23
23 -
 24
24 -
 25
25 -
 26
26 -
 27
27 -
 28
28 -
 29
29 -
 30
30 -
 31
31 -
 32
32 -
 33
33 -
 34
34 -
 35
35 -
 36
36
 |
 |

28
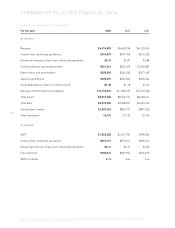
SUMMARY OF SELECTED FINANCIAL DATA
Dollars in thousands, except per share amounts
For the year 2003 2002 2001
As reported
Revenue $4,576,853 $4,409,758 $4,122,474
Income from continuing operations $494,847 $437,706 $514,320
Diluted earnings per share from continuing operations $2.10 $1.81 $2.08
Cash provided by operating activities $851,261 $502,559 $1,035,887
Depreciation and amortization $288,808 $264,250 $317,449
Capital expenditures $285,681 $224,834 $256,204
Cash dividends per share of common stock $1.20 $1.18 $1.16
Average common shares outstanding 236,165,024 241,483,539 247,615,560
Total assets $8,891,388 $8,732,314 $8,318,471
Total debt $3,573,784 $3,968,551 $3,494,310
Stockholders' equity $1,087,362 $853,327 $891,355
Total employees 32,474 33,130 32,724
As adjusted
EBIT $1,002,628 $1,011,781 $996,902
Income from continuing operations $569,471 $572,011 $556,274
Diluted earnings per share from continuing operations $2.41 $2.37 $2.25
Free cash flow $688,331 $681,964 $646,610
EBIT to interest 6.1x 5.6x 5.4x
Please refer to page 29 for a discussion on the presentation of adjusted financial results and a reconciliation of adjusted results to results reported in
accordance with generally accepted accounting principles (GAAP).