Panasonic 2011 Annual Report Download - page 12
Download and view the complete annual report
Please find page 12 of the 2011 Panasonic annual report below. You can navigate through the pages in the report by either clicking on the pages listed below, or by using the keyword search tool below to find specific information within the annual report.
To Our Stakeholders Message from the President
Financial
Highlights Top Message Group Strategies Corporate
Governance
Financial and
Corporate Data
R&D Design Intellectual
Property
Segment
Information
Search Contents Return Next
page 11
Panasonic Annual Report 2011
Highlights
Message from the President
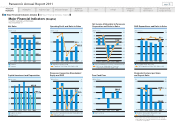
From a profit perspective, operating profit
amounted to 305.3 billion yen, a significant
year-on-year improvement of 114.8 billion yen.
This reflected the positive flow-on effect of sales
growth and successful efforts to streamline
material costs. Accounting for these factors, the
operating profit to sales ratio increased 0.9% to
3.5%. In fiscal 2011, the Group brought forward
several business and organizational restructuring
measures. As a result, business restructuring
expenses totaled 80.4 billion yen, surpassing
estimates identified at the beginning of the
period. Compared with fiscal 2010, however,
business restructuring expenses decreased 64.1
billion yen translating to a considerable
improvement in other deductions. Taking the
aforementioned into consideration, income before
income taxes amounted to 178.8 billion yen, a
year-on-year turnaround of 208.1 billion yen. After
incurring a net loss in fiscal 2010, Panasonic
recorded a positive about-face of 177.5 billion
yen. Returning to the black for the first time since
fiscal 2008, net income attributable to Panasonic
Corporation came to 74.0 billion yen.
Despite the burdens imposed by the
severe business condition and in particular
foreign currency exchange losses due mainly
to persistent appreciation of the yen, the
sharp rise in raw materials costs and the
impact of the March 2011 earthquake*3, we
believe fiscal 2011 was a year of certain
accomplishment and results.
*1 Consolidated net sales in fiscal 2010 included the
operating results of SANYO and its subsidiaries for the
three-month period (January to March) only. Consolidated
net sales for fiscal 2011, on the other hand, include
the operating results of SANYO and its subsidiaries for
the full fiscal year (April 2010 to March 2011).
*2 BRICs+V: Brazil, Russia, India, China and Vietnam;
MINTS+B: Mexico, Indonesia, Nigeria, Turkey, Saudi
Arabia and the Balkans
*3 The negative impact of the Great East Japan Earthquake
that occurred in the fourth quarter of fiscal 2011 on net
sales, operating profit, income before income taxes
and net income attributable to Panasonic Corporation
are estimated at 70.0 billion yen, 21.0 billion yen, 30.2
billion yen and 19.0 billion yen, respectively.
Consolidated net sales improved 17%
compared with fiscal 2010 to 8,692.7 billion
yen in fiscal 2011. This was due mainly to the
consolidation of SANYO and its subsidiaries
and double-digit sales growth*1 in all regions
both in and outside Japan.
Overseas sales were particularly robust
in such emerging countries as BRICs+V and
MINTS+B*2, positioned as countries of
considerable significance and serving as an
engine driving overall growth. Sales in Japan
of consumer products reached an all-time
high, due mainly to the favorable conditions
generated by the Japanese government’s
“eco-point” subsidy program.
Achieved double-digit sales growth both
in and outside Japan; secured a return
to net income attributable to Panasonic
Corporation for the first time in three years
Overview of Fiscal 2011 Results
Net Sales
10
8
6
4
2
0
Trillions of yen
2010 2011
8.7
7.4
500
400
300
200
100
0
Billions of yen
2010 2011
305.3
Operating Profit
Income (Loss)
Before Income Taxes
100
50
0
–50
–100
–150
Billions of yen
(Fiscal year)(Fiscal year)(Fiscal year)(Fiscal year) 2010 2011
74.0
–103.5
Net Income (Loss) Attributable
to Panasonic Corporation
Billions of yen
200
150
100
50
0
–50
–100 2010 2011
178.8
–29.3
Year on
year
+17%
Year on
year
+60%
190.5
Return
to profit
Return
to profit
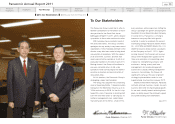
Fumio Ohtsubo, President
In an effort to provide readers
with a deeper understanding of the
Company, I would like to provide
an overview of our results in fiscal
2011, the period from April 1, 2010
to March 31, 2011, an outline of our
progress under GT12, the Group’s
midterm management plan, details
of the Group’s reorganization and
new growth strategies, key initiatives
earmarked for fiscal 2012 and
additional pertinent information.


