Oki 2010 Annual Report Download - page 7
Download and view the complete annual report
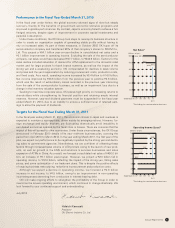
Please find page 7 of the 2010 Oki annual report below. You can navigate through the pages in the report by either clicking on the pages listed below, or by using the keyword search tool below to find specific information within the annual report.-
 1
1 -
 2
2 -
 3
3 -
 4
4 -
 5
5 -
 6
6 -
 7
7 -
 8
8 -
 9
9 -
 10
10 -
 11
11 -
 12
12 -
 13
13 -
 14
14 -
 15
15 -
 16
16 -
 17
17 -
 18
18 -
19
-
20
-
21
-
22
-
23
-
24
-
25
-
26
-
27
-
28
-
29
-
30
-
31
-
32
-
33
-
34
-
35
-
36
-
37
-
38
-
39
-
40
-
41
-
42
-
43
-
44
-
45
-
46
-
47
-
48
-
49
-
50
-
51
-
52
-
53
-
54
-
55
-
56
 |
 |

Annual Report 2010 3
800
(Billions of yen)
(Ended March 31) (Ended March 31)
(As of March 31)
(As of March 31)
(Ended March 31)
(Ended March 31)
(Ended March 31)
(As of March 31)
(Ended March 31)
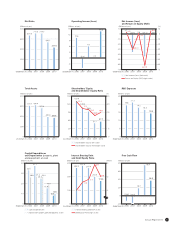
Net Sales
600
400
200
2008
0
20072006 2009 2010
719.7718.8
680.5
545.7
443.9
15
(Billions of yen)
Operating Income (Loss)
9
3
-3
2008
12
6
0
-6
20072006 2009 2010
6.2
(5.4)
10.6
0.4
14.0
40
(Billions of yen)
Capital Expenditures
and Depreciation (property, plant
and equipment, at cost)
30
20
10
2008
0
20072006 2009 2010
800
(Billions of yen)
Total Assets
600
400
200
2008
0
20072006 2009 2010
570.8
628.4
618.7
397.0 383.6
10
(Billions of yen) (%)
Net Income (Loss)
and Return on Equity (ROE)
Net Income (Loss) (left scale)
Return on Equity (ROE) (right scale)
-10
-30
-50
2008
-60
0
-20
-40
-70
10
-10
-30
-50
0
-20
-40
-60
-70
20072006 2009 2010
0.6
(36.4)
5.1
(45.0)3.6
150
(Billions of yen) (%)
Shareholders’ Equity
and Shareholders’ Equity Ratio
120
60
30
2008
0
25
20
90 15
10
5
0
(Times)
4
3
2
0
20072006 2009 2010
94.6
109.4
133.9
51.7
57.7
16.6
17.4
21.6
13.0
15.0
25
(Billions of yen)
R&D Expenses
15
20
10
5
2008
0
20072006 2009 2010
18.2
21.3
19.6
16.8
14.6
300
(Billions of yen)
Interest Bearing Debt
and Debt/Equity Ratio
200
100
2008
0
20072006 2009 2010
267.4
284.8
268.3
203.8
80
(Billions of yen)
Free Cash Flow
60
40
0
2008
20
-20
20072006 2009 2010
0.6
(30.0)
3.9
(61.5)
6.6
2.8
2.6
2.0
3.9
3.0
19.7
(18.8)
(13.6)
76.4
38.3
172.5
Shareholders’ Equity (left scale)
Shareholders’ Equity Ratio (right scale)
Capital Expenditures
Depreciation (property, plant and equipment, at cost)
Interest Bearing Debt (left scale)
Debt/Equity Ratio (right scale)
25.4
37.7
33.5
15.9
8.6
26.8
27.3
26.6
18.8
10.5