North Face 2000 Annual Report Download - page 34
Download and view the complete annual report
Please find page 34 of the 2000 North Face annual report below. You can navigate through the pages in the report by either clicking on the pages listed below, or by using the keyword search tool below to find specific information within the annual report.-
 1
1 -
2
-
3
-
4
-
5
-
6
-
7
-
8
-
9
-
10
-
11
-
12
-
13
-
14
-
15
-
16
-
17
-
18
-
19
-
20
-
21
-
22
-
23
-
 24
24 -
 25
25 -
 26
26 -
 27
27 -
 28
28 -
 29
29 -
 30
30 -
 31
31 -
 32
32 -
 33
33 -
 34
34 -
 35
35 -
 36
36 -
 37
37 -
 38
38 -
 39
39 -
 40
40
 |
 |

32
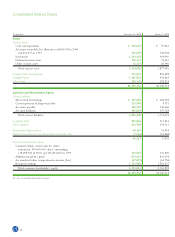
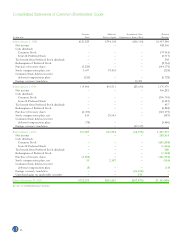
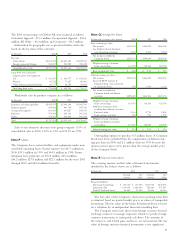
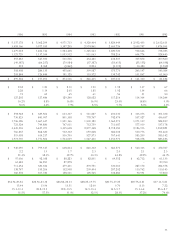
Deferred income tax assets and liabilities consist of the following:
In thousands 2000 1999
Deferred income tax assets:
Employee benefits $ 53,064 $ 51,582
Inventories 23,463 19,990
Other accrued expenses 117,511 79,767
Operating loss carryforwards 104,143 71,911
Foreign currency translation 46,372 34,869
344,553 258,119
Valuation allowance (57,033) (46,526)
Deferred income tax assets 287,520 211,593
Deferred income tax liabilities:
Depreciation 45,985 56,103
Other 32,124 25,244
Deferred income tax liabilities 78,109 81,347
Net deferred income tax assets $209,411 $130,246
Amount included in:
Current Assets $118,314 $ 74,067
Other Assets 91,097 56,179
$209,411 $130,246
As of the end of 2000, the Company has not provided deferred
U.S. income taxes on $18.7 million of undistributed earnings of
international subsidiaries where such earnings are considered to be
permanently invested. The Company has $185.1 million of foreign
operating loss carryforwards expiring at various dates; a valuation
allowance has been provided where it is more likely than not that
the deferred tax assets relating to certain of those loss carryforwards
will not be realized. Income taxes paid were $183.4 million in
2000, $228.0 million in 1999 and $215.2 million in 1998.
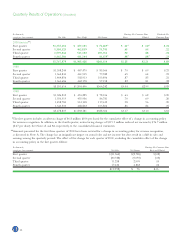
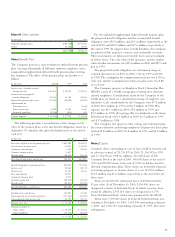
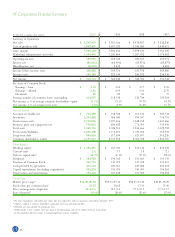
Note O Business Segment Information
The Company designs and manufactures apparel products marketed
primarily under Company-owned brand names. Customers are
primarily department, discount and specialty stores throughout
the world.
The Company manages its businesses through separate market-
ing companies that support specific brands. Manufacturing and
product sourcing needs are met by groups that support individual
or in some cases several different product types. These operations
have been aggregated into three reportable segments. The
“Consumer Apparel” segment includes jeanswear and related
products, women’s intimate apparel and swimwear, and children’s
apparel, all having similar characteristics of economic performance,
product type, production process, method of distribution and class
of customer. The “Occupational Apparel” segment is distinguished
from the Consumer Apparel segment because of a different class
of customer. The “All Other” segment consists of the Company’s
knitwear, outdoor apparel and equipment, and daypack operations,
which have different product or economic characteristics than
those in the other segments.
Management evaluates the operating performance of each of
its marketing companies based on their income from operations.
Accounting policies used for segment reporting are consistent with
those stated in Note A, except that inventories are valued on a
first-in, first-out basis and that interest income and expense and
amortization of intangible assets are not allocated to individual
segments. Corporate and other expenses include expenses incurred
in and directed by the Corporate offices that are not allocated to
specific business units. Segment assets are those used directly in
the operations of each business unit, such as accounts receivable,
inventories and property, plant and equipment. Corporate assets
include investments and deferred income taxes. Financial informa-
tion for the Company’s reportable segments is as follows:
In thousands 2000 1999 1998
Net sales:
Consumer Apparel $4,227,997 $4,276,809 $4,313,082
Occupational Apparel 661,635 640,227 482,931
All Other 858,247 634,580 682,794
Consolidated net sales $5,747,879 $5,551,616 $5,478,807
Segment profit:
Consumer Apparel $ 605,197 $ 629,127 $ 693,638
Occupational Apparel 3,050 79,164 80,988
All Other 54,897 57,715 38,686
Total segment profit 663,144 766,006 813,312
Interest, net (81,032) (62,490) (55,871)
Amortization of intangible assets (36,400) (33,097) (32,890)
Corporate and other expenses (114,179) (74,843) (92,953)
Consolidated income before
income taxes $ 431,533 $ 595,576 $ 631,598
Segment assets:
Consumer Apparel $1,780,493 $1,783,225 $1,858,873
Occupational Apparel 348,134 379,004 247,734
All Other 457,195 332,850 377,155
Total segment assets 2,585,822 2,495,079 2,483,762
Cash and equivalents 118,891 79,861 63,208
Intangible assets 1,101,876 992,463 951,562
Corporate assets 551,567 459,111 338,134
Consolidated assets $4,358,156 $4,026,514 $3,836,666
Capital expenditures:
Consumer Apparel $ 68,115 $ 97,196 $ 129,532
Occupational Apparel 11,072 20,845 19,362
All Other 14,920 8,358 11,480
Corporate 31,117 23,677 28,685
Consolidated capital expenditures $ 125,224 $ 150,076 $ 189,059
Depreciation expense:
Consumer Apparel $ 83,260 $ 89,313 $ 83,382
Occupational Apparel 15,515 14,958 11,769
All Other 24,295 23,555 26,165
Corporate 13,952 6,509 7,179
Consolidated depreciation expense $ 137,022 $ 134,335 $ 128,495