North Face 2000 Annual Report Download - page 20
Download and view the complete annual report
Please find page 20 of the 2000 North Face annual report below. You can navigate through the pages in the report by either clicking on the pages listed below, or by using the keyword search tool below to find specific information within the annual report.-
 1
1 -
2
-
3
-
4
-
5
-
6
-
7
-
8
-
9
-
 10
10 -
 11
11 -
 12
12 -
 13
13 -
 14
14 -
 15
15 -
 16
16 -
 17
17 -
 18
18 -
 19
19 -
 20
20 -
 21
21 -
 22
22 -
 23
23 -
 24
24 -
 25
25 -
 26
26 -
 27
27 -
 28
28 -
 29
29 -
 30
30 -
31
-
32
-
33
-
34
-
35
-
36
-
37
-
38
-
39
-
40
 |
 |

18
due to higher U.S. tax credits, taxes not provided on
permanently invested foreign earnings and lower state
income taxes.
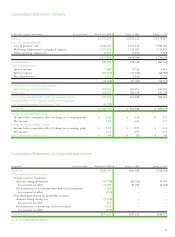
Reported net income was $260.3 million in 2000, or
$2.25 per share, compared with $366.2 million ($3.04
per share) in 1999 and $388.3 million ($3.17 per share)
in 1998. Excluding the effects of restructuring charges
and the cumulative effect of a change in accounting
policy, net income in 2000 was $343.8 million, or $2.98
per share. Net income declined by 6% from the 1999
level, while earnings per share declined by 2%, reflecting
the benefit of the Company’s share repurchase program.
The 2000 acquisitions had a $.06 negative impact on
2000 reported earnings per share, and the stronger U.S.
dollar in 2000 had a $.05 negative impact on earnings
per share compared with the prior year. Similarly, 1999
net income declined by 6% from 1998, while earnings
per share declined by 4%, again reflecting the benefit of
the Company’s share repurchase program.
Information by Business Segment
The Consumer Apparel segment consists of jeanswear,
women’s intimate apparel, women’s swimwear, and the
children’s apparel businesses. Overall, segment sales
declined by 1% in each of the last two years. In 2000,
domestic jeanswear sales increased by 5%, with strength
across the mass, western and Lee marketing units.
European jeanswear sales declined due to the negative
effects of foreign currency translation. In other inter-
national markets, jeanswear sales increases in Latin
America were offset by a decline in the Wrangler busi-
ness in Japan. Domestic intimate apparel sales declined
9% in 2000, as increases in department store brands
were more than offset by the absence of new private
label programs and by a reduction in Vassarette brand
sales in the mass channel of distribution. Segment
profit in 2000, excluding $71.0 million of restructuring
charges, increased 7% over 1999, led by growth in sales
and profit margins in both domestic and international
jeanswear. In 1999, sales increases in mass market
domestic jeanswear and in the newly acquired Latin
American jeanswear businesses offset declines reported
in the Lee branded domestic business and in European
jeanswear businesses. The decline in Lee related to the
overall softness in retail sales in mid-tier department
stores in the U.S., and the decline in Europe was due
to a consumer shift away from basic jeans products to
alternative fabrics and styles. Segment profit in 1999
declined due to lower sales in Lee, lower sales in
Europe, operating difficulties resulting from European
jeanswear consolidation efforts, and a $6 million charge
to close the Jantzen women’s sportswear division.
The Occupational Apparel segment includes
the Company’s industrial, career and safety apparel
businesses. Sales increases in each of the last two years
were due to one acquisition in the latter part of 1998
and three acquisitions in early 1999. Segment profit in
2000 includes $34.6 million of restructuring costs.
Excluding these restructuring costs, segment profit still
declined significantly in 2000 due to manufacturing
and distribution inefficiencies related to integration of
the recently acquired companies. Segment profit in
1999 declined as a percent of sales from 1998 due to
the lower level of profitability of the acquired businesses
and to systems, distribution and other costs incurred
to integrate these new businesses into VF’s existing
infrastructure.
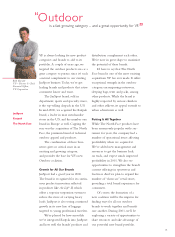
The All Other segment includes the Company’s
knitwear and outdoor-related businesses represented
by the JanSport and Eastpak brands (backpacks and
daypacks) and The North Face branded products
(outerwear and equipment). Sales increased primarily
from The North Face and Eastpak acquisitions in
May 2000. Segment profit, excluding $6.0 million
of restructuring costs in 2000, advanced only slightly
from the prior year level because of the low level of
profitability of the newly acquired businesses. Sales and
profit, excluding restructuring costs, in the Company’s
knitwear business increased in 2000 from the 1999
levels. With difficult market conditions and pricing
pressures, our knitwear profitability continues to be
below overall Company averages.
Analysis of Financial Condition
In managing its capital structure, it is management’s
goal to maintain a debt to capital ratio of less than
40%, while providing flexibility to pursue investment
opportunities that may become available. Our debt to
capital ratio remains within these guidelines: 34.7% at
the end of 2000 and 30.1% at the end of 1999.
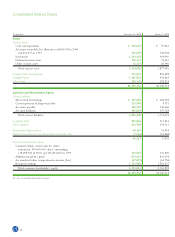
Balance Sheets
Even with higher fourth quarter sales, accounts receiv-
able decreased in 2000 due to slightly lower day’s
sales outstanding. Inventories increased 17% in 2000.
Excluding businesses acquired in 2000, inventories
increased by 6%, primarily due to increases at domestic
jeanswear as their sales have grown. Management
has targeted an inventory reduction of as much as
$100 million during 2001.
Intangible assets increased during 2000 due to the
acquisitions completed during the year. This increase
was partially offset by the reduction in intangible assets
related to disposition of the Wrangler business in Japan.
The increase in other accrued liabilities results
from the restructuring charges recorded in the fourth
quarter of 2000.
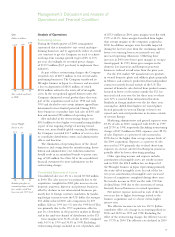
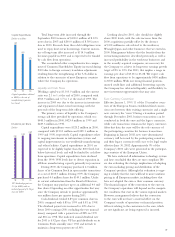
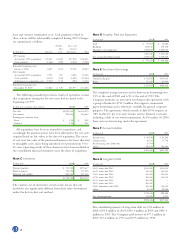
Debt to Capital Ratio
Percent
27.1
30.1
34.7
98 99 00
VF’s debt to capital ratio
remains well within our
target range, providing
f
lexibility to pursue a variet
y
o
f
investment o
pp
ortunities.
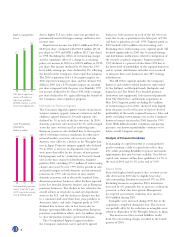
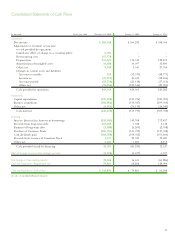
Cash Provided by
Operations
Dollars in millions
429 423
443
98 99 00
Cash provided by operations
remains strong, due in part
to VF’s conservative manage-
ment o
f
workin
g
ca
p
ital.