North Face 2000 Annual Report Download - page 19
Download and view the complete annual report
Please find page 19 of the 2000 North Face annual report below. You can navigate through the pages in the report by either clicking on the pages listed below, or by using the keyword search tool below to find specific information within the annual report.-
 1
1 -
2
-
3
-
4
-
5
-
6
-
7
-
8
-
 9
9 -
 10
10 -
 11
11 -
 12
12 -
 13
13 -
 14
14 -
 15
15 -
 16
16 -
 17
17 -
 18
18 -
 19
19 -
 20
20 -
 21
21 -
 22
22 -
 23
23 -
 24
24 -
 25
25 -
 26
26 -
 27
27 -
 28
28 -
 29
29 -
30
-
31
-
32
-
33
-
34
-
35
-
36
-
37
-
38
-
39
-
40
 |
 |

17
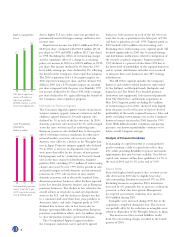
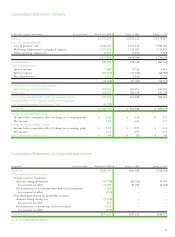
of $55.9 million in 2000, gross margins were flat with
1999 at 34.1%. Gross margins benefited from higher
than average margins in the companies acquired in
2000. In addition, margins were favorably impacted
during the last two years from the continuing shift to
lower cost sourcing, lower raw material costs and
increased operating efficiencies. Offsetting these
increases in 2000 were lower gross margins in occupa-
tional apparel. In 1999, lower gross margins in the
domestic Lee jeanswear and European jeanswear
businesses reduced overall ratios from the prior year.
For the U.S. market, VF manufactures its products
in owned domestic plants and offshore plants, primarily
in Mexico, and contracts production from independent
contractors mostly located outside of the U.S. The
amount of domestic sales derived from products manu-
factured in lower cost locations outside the U.S. has
increased each year over the last three years to where
now 67% is sourced from international locations.
Similarly, in foreign markets over the last three years,
sourcing has shifted from higher cost owned plants
located primarily in western Europe to lower cost
owned and contracted production in locations outside
of western Europe.
Marketing, administrative and general expenses were
23.5% of sales in 2000, compared with 22.2% in 1999
and 21.9% in 1998, respectively. Excluding restructuring
charges of $37.2 million in 2000, expenses were 22.9%
of sales. Expenses as a percent of sales increased in
2000 due to the higher than average expense levels of
the 2000 acquisitions. Expenses as a percent of sales
increased in 1999 primarily due to fixed short-term
expenses on a lower sales level in European jeanswear,
partially offset by lower advertising spending.
Other operating income and expense includes
amortization of intangible assets, net royalty income
and, in 2000, the $26.8 million loss on disposal of
the Wrangler business in Japan representing primarily
the write-off of intangible assets. In each of the last
two years, amortization of intangible assets increased
because of acquisitions completed during those years.
Net royalty income in 2000 was flat with 1999 but
declined from 1998 due to the conversion of certain
formerly licensed businesses to owned operations.
Net interest expense increased in each of the last
two years due to higher borrowings related to the
business acquisitions and, to a lesser extent, higher
interest rates.
The effective income tax rate was 38.1% (before
cumulative effect of a change in accounting policy) in
2000 and 38.5% in 1999 and 1998. Excluding the
effect of the restructuring charges, the effective tax rate
was 37.7% in 2000. The effective rate declined in 2000
Analysis of Operations
Restructuring Actions
During the fourth quarter of 2000, management
announced that it intended to exit several underper-
forming businesses and to aggressively reduce its overall
cost structure to get the Company on track to achieve
our long-term earnings growth target of 8% to 10%
per year. Accordingly, we recorded pretax charges
of $119.9 million ($.67 per share) to implement these
initiatives.
As part of these restructuring charges, the Company
recorded costs of $69.7 million to exit several under-
performing businesses. The Company transferred its
Wrangler business in Japan to a licensee and incurred
a loss on disposition of $26.8 million, of which
$23.8 million related to the write-off of intangible
assets. In the occupational apparel business units, the
Company eliminated several product lines that were
part of the acquisitions made in late 1998 and early
1999 and decided to exit certain intimate apparel lines
determined to have limited potential. During 2000,
these businesses or product lines had sales of $101 mil-
lion and incurred $20 million of operating losses.
Also included in the restructuring charges was
$18.5 million to close higher cost manufacturing facilities
as part of our ongoing strategy of moving toward
lower cost, more flexible global sourcing. In addition,
the Company recorded $31.7 million of costs to close
or consolidate distribution centers and administrative
offices and functions.
The elimination of operating losses of the closed
businesses and savings from the manufacturing, distri-
bution and administrative cost reduction initiatives
should result in an annualized benefit to pretax earn-
ings of $45 million. See Note M to the consolidated
financial statements for more information on the
restructuring charges.
Consolidated Statements of Income
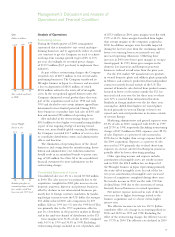
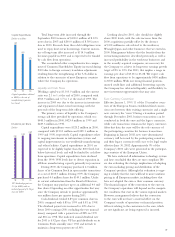
Consolidated sales rose 4% to a record $5,748 million
in 2000. The sales increase was primarily due to the
acquisitions completed in 2000, plus increases in our
domestic jeanswear, knitwear and playwear businesses,
offset by declines in our international businesses pri-
marily due to foreign currency translation. In translat-
ing foreign currencies into the U.S. dollar, the stronger
U.S. dollar reduced 2000 sales comparisons by $73
million. Sales in 1999 rose 1% over the 1998 level. This
was primarily due to the 1999 acquisitions, offset in
part by a slowdown in the jeanswear market in Europe
and in the mid-tier channel of distribution in the U.S.
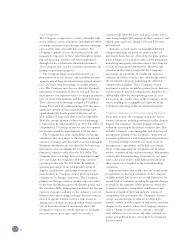
Gross margins were 33.2% of sales in 2000, compared
with 34.1% in 1999 and 34.5% in 1998. Excluding
restructuring charges included in cost of products sold
Management’s Discussion and Analysis of
Operations and Financial Condition
Sales
D
ollars
in
millions
5
,
47
9
5,552
5
,
74
8
98
99
00
S
ales reached record level
s
in 2000.
Gross Margin
P
ercent
to
sales
34.
5
3
4.
1
33.2
98
99
00
Excludin
g
the e
ff
ects o
f
restructuring charges in 2000,
g
ross margins would have
been even with 1999 levels.