North Face 2000 Annual Report Download - page 21
Download and view the complete annual report
Please find page 21 of the 2000 North Face annual report below. You can navigate through the pages in the report by either clicking on the pages listed below, or by using the keyword search tool below to find specific information within the annual report.-
 1
1 -
2
-
3
-
4
-
5
-
6
-
7
-
8
-
9
-
10
-
 11
11 -
 12
12 -
 13
13 -
 14
14 -
 15
15 -
 16
16 -
 17
17 -
 18
18 -
 19
19 -
 20
20 -
 21
21 -
 22
22 -
 23
23 -
 24
24 -
 25
25 -
 26
26 -
 27
27 -
 28
28 -
 29
29 -
 30
30 -
 31
31 -
32
-
33
-
34
-
35
-
36
-
37
-
38
-
39
-
40
 |
 |

19
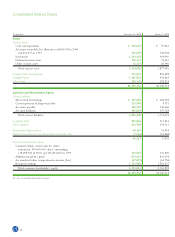
Total long-term debt increased through the
September 2000 issuance of $300.0 million of 8.10%
notes due in 2005 and $200.0 million of 8.50% notes
due in 2010. Proceeds from these debt obligations were
used to repay short-term borrowings. Current maturi-
ties of long-term debt increased as $114.0 million
becomes payable in 2001 and is expected to be funded
by cash flow from operations.
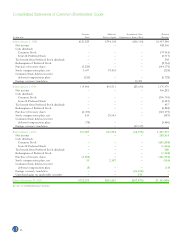
The accumulated other comprehensive loss compo-
nent of Common Shareholders’ Equity increased during
2000 due to foreign currency translation adjustments
resulting from the strengthening of the U.S. dollar in
relation to the currencies of most European countries
where the Company has operations.
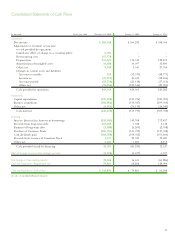
Liquidity and Cash Flows
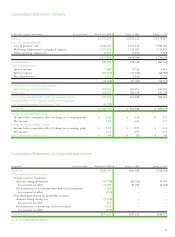
Working capital was $1,103.9 million and the current
ratio was 2.1 to 1 at the end of 2000, compared with
$763.9 million and 1.7 to 1 at the end of 1999. The
increase in 2000 was due to the increase in inventories
and repayment of short-term borrowings with the
proceeds of the long-term debt offering.
The primary source of liquidity is the Company’s
strong cash flow provided by operations, which was
$443.3 million in 2000, $423.4 million in 1999 and
$429.3 million in 1998.
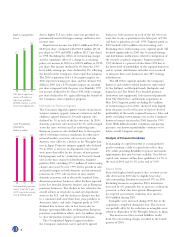
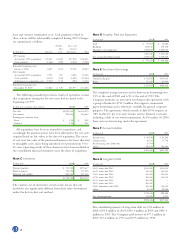
Capital expenditures were $125.2 million in 2000,
compared with $150.1 million and $189.1 million in
1999 and 1998, respectively. Capital expenditures relate
to ongoing investments in information systems and
capital improvements in our worldwide manufacturing
and other facilities. Capital expenditures in 2001 are
expected to be slightly higher than the 2000 level, but
below historical levels, and will be funded by cash flow
from operations. Capital expenditures have declined
from the 1999/1998 levels due to slower expansion in
offshore manufacturing capacity, primarily in jeanswear.
During 2000, the Company purchased 4.0 million
shares of its Common Stock in open market transactions
at a cost of $105.7 million. During 1999, the Company
purchased 4.0 million shares for $149.1 million. Under
its current authorization from the Board of Directors,
the Company may purchase up to an additional 4.0 mil-
lion shares. Depending on other opportunities that may
arise, the Company intends to purchase approximately
one million shares per quarter during 2001.
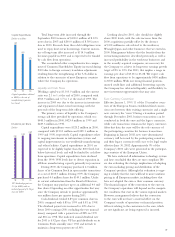
Cash dividends totaled $.89 per common share in
2000, compared with $.85 in 1999 and $.81 in 1998.
The dividend payout rate increased to 40% due to
lower 2000 earnings (30% excluding the two unusual
items), compared with a payout rate of 28% in 1999
and 26% in 1998. The indicated annual dividend rate
for 2001 is $.92 per share. VF has paid dividends on its
Common Stock annually since 1941 and intends to
maintain a long-term payout rate of 30%.
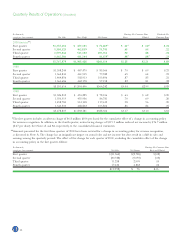
Looking ahead to 2001, sales should rise slightly
above 2000 levels, with the sales increases from the
2000 acquisitions partially offset by the absence
of $101 million in sales related to the workwear,
Wrangler Japan and other businesses that we exited in
2000. Management believes that the benefits from the
restructuring initiatives described previously, as well as
increased profitability in the workwear businesses and
in the recently acquired companies, are necessary for
the Company to achieve its long-term earnings growth
target of 8% to 10%. For 2001, that implies a range in
earnings per share of $3.21 to $3.28. We expect cash
flow from operations to be approximately $450 million
to $500 million. With our strong financial position,
unused credit lines and additional borrowing capacity,
the Company has substantial liquidity and flexibility to
meet investment opportunities that may arise.
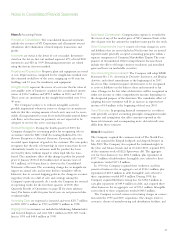
Euro Currency Conversion
Effective January 1, 1999, 11 of the 15 member coun-
tries of the European Union established fixed conver-
sion rates between their existing currencies and a single
new currency, the “euro.” During a transition period
through December 2001, business transactions can be
conducted in both the euro and the legacy currencies,
while cash transactions remain in the legacy currencies.
After that date, the euro will be the sole currency of
the participating countries for business transactions.
Beginning in January 2002, new euro-denominated
currency will be issued by the participating countries,
and their legacy currencies will cease to be legal tender
effective June 30, 2002. Approximately 9% of the
Company’s 2000 sales were generated in the participat-
ing countries of the European Union.
We have evaluated all information technology systems
and have concluded that they are euro compliant. We
are also evaluating the strategic implications of adopting
the euro, including pricing and distribution of the
Company’s products. Although this evaluation is ongo-
ing, it is likely that the euro will lead to more uniform
pricing in all European markets, including those that
have not adopted the euro as their common currency.
The financial impact of the conversion to the euro on
the Company’s operations will depend on the competi-
tive conditions that exist in the various regional markets.
However, management believes that the conversion
to the euro will not have a material effect on the
Company’s results of operations or financial position.
All costs relating to the conversion to the euro, which
are not significant, are being expensed as incurred.
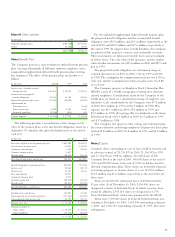
Capital Expenditures
Dollars in millions
189
150
125
98 99 00
Capital expenditures declined
in 2000, as the rate of
manufacturing expansion
has slowed.
Dividends per Share
Dollars
0.81
0.85
0.89
98 99 00
VF’s dividend payout rose
5% for 2000, with an
indicated payout of $.92 pe
r
share for 2001.