North Face 1999 Annual Report Download - page 34
Download and view the complete annual report
Please find page 34 of the 1999 North Face annual report below. You can navigate through the pages in the report by either clicking on the pages listed below, or by using the keyword search tool below to find specific information within the annual report.-
 1
1 -
2
-
3
-
4
-
5
-
6
-
7
-
8
-
9
-
10
-
11
-
12
-
13
-
14
-
15
-
16
-
17
-
18
-
19
-
20
-
21
-
22
-
23
-
 24
24 -
 25
25 -
 26
26 -
 27
27 -
 28
28 -
 29
29 -
 30
30 -
 31
31 -
 32
32 -
 33
33 -
 34
34 -
 35
35 -
 36
36 -
 37
37 -
 38
38 -
 39
39 -
 40
40
 |
 |

[32]
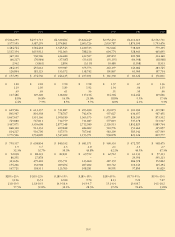
VF CORPORATION FINANCIAL SUMMARY
In thousands, except per share amounts 1999 1998 1997 1996
Summary of Operations
Net sales $5,551,616 $ 5,478,807 $5,222,246 $ 5,137,178
Cost of products sold 3,657,120 3,586,686 3,440,611 3,458,166
Gross margin 1,894,496 1,892,121 1,781,635 1,679,012
Marketing, administrative and other 1,241,864 1,207,952 1,176,562 1,121,729
Operating income 652,632 684,169 605,073 557,283
Interest, net (62,490) (55,871) (25,877) (49,387)
Miscellaneous, net 5,434 3,300 6,684 512
Income before income taxes 595,576 631,598 585,880 508,408
Income taxes 229,334 243,292 234,938 208,884
Net income $ 366,242 $ 388,306 $ 350,942 $ 299,524
Per share of Common Stock1
Earnings – basic $ 3.04 $ 3.17 $ 2.76 $ 2.32
Earnings – diluted 2.99 3.10 2.70 2.28
Dividends .85 .81 .77 .73
Average number of common shares outstanding 118,538 120,744 125,504 127,292
Net income as % of average common shareholders’ equity 17.3% 19.7% 18.2% 16.2%
Net income as % of average total assets 8.9% 10.2% 10.1% 8.6%
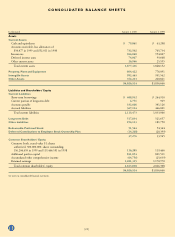
Financial Position
Accounts receivable, net $ 732,502 $ 705,734 $ 587,934 $ 592,942
Inventories 964,040 954,007 774,755 730,823
Total current assets 1,877,416 1,848,152 1,601,466 1,706,326
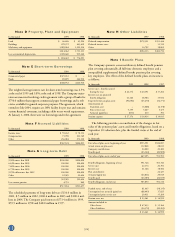
Property, plant and equipment, net 804,422 776,091 705,990 721,524
Total assets 4,026,514 3,836,666 3,322,782 3,449,535
Total current liabilities 1,113,473 1,033,006 765,908 766,267
Long-term debt 517,834 521,657 516,226 519,058
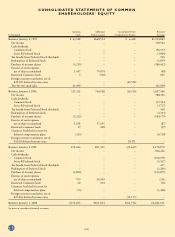
Common shareholders’ equity 2,163,818 2,066,308 1,866,769 1,973,739
Other Statistics
Working capital $ 763,943 $ 815,146 $ 835,558 $ 940,059
Current ratio 1.7 1.8 2.1 2.2
Debt to capital ratio230.1% 27.1% 22.5% 21.4%
Dividends $ 104,302 $ 101,660 $ 100,141 $ 97,036
Purchase of Common Stock 149,075 147,398 391,651 61,483
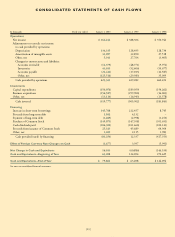
Cash provided by operations 423,361 429,282 460,652 711,454
Capital expenditures (excluding acquisitions) 150,076 189,059 154,262 138,747
Depreciation and amortization 167,432 161,385 156,252 160,578
Market Data
Market price range1$ 55-277⁄16 $5411⁄16-337⁄16 $48
1⁄4-321⁄4$3415⁄16-2313⁄16
Book value per common share118.62 17.30 15.40 15.44
Price earnings ratio – high-low 18.1-9.0 17.3-10.5 17.5-11.7 15.1-10.3
Rate of payout328.0% 25.6% 27.9% 31.5%
1Per share computations and market price ranges have been adjusted to reflect a two-for-one stock split in November 1997.
2Capital is defined as common shareholders’ equity plus short-term and long-term debt.
3Dividends per share divided by earnings per share.