Nikon 2012 Annual Report Download - page 3
Download and view the complete annual report
Please find page 3 of the 2012 Nikon annual report below. You can navigate through the pages in the report by either clicking on the pages listed below, or by using the keyword search tool below to find specific information within the annual report.-
 1
1 -
 2
2 -
 3
3 -
 4
4 -
 5
5 -
 6
6 -
 7
7 -
 8
8 -
 9
9 -
 10
10 -
 11
11 -
 12
12 -
 13
13 -
 14
14 -
15
-
16
-
17
-
18
-
19
-
20
-
21
-
22
-
23
-
24
-
25
-
26
-
27
-
28
-
29
-
30
-
31
-
32
-
33
-
34
-
35
-
36
-
37
-
38
-
39
-
40
-
41
-
42
-
43
-
44
-
45
-
46
-
47
-
48
-
49
-
50
-
51
-
52
-
53
-
54
-
55
-
56
-
57
-
58
-
59
-
60
-
61
-
62
-
63
-
64
-
65
-
66
 |
 |

1
NIKON CORPORATION ANNUAL REPORT 2012
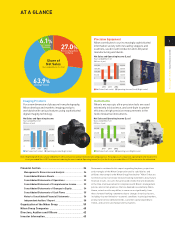
AT A GLANCE
Imaging Products
For a new dimension of pleasure from photography,
Nikon develops and markets imaging products
worldwide with various features using sophisticated
digital imaging technology.
Instruments
Nikon’s microscopic ultra-precision tools are used
extensively in bioscience, and contribute to greater
efficiency in high-precision measurements in the
field of industrial instruments.
Statements contained in this report regarding the plans, projections
and strategies of the Nikon Corporation and its subsidiaries and
affiliates that comprise the Nikon Group (hereinafter “Nikon”) that are
not historical fact constitute forward-looking statements about future
financial results. As such, they are based on data that are obtainable
at the time of announcement in compliance with Nikon’s management
policies and certain premises that are deemed reasonable by Nikon.
Hence, actual results may differ, in some cases significantly, from
these forward-looking statements due to changes in various factors,
including—but not limited to—economic conditions in principal markets,
product and service demand trends, customer capital expenditure
trends, and currency exchange rate fluctuations.
Precision Equipment
Nikon contributes to our increasingly sophisticated
information society with its leading steppers and
scanners, used in semiconductor and LCD panel
manufacturing worldwide.
27.0%
Precision Equipment
Company
63.9%
Imaging Company
6.1%
Instruments
Company
Share of
Net Sales
Year ended March 31, 2012
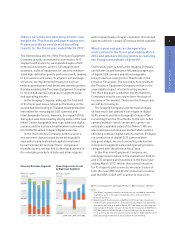
Note: Beginning with the fiscal year ended March 2012, we have revised our method of allocating expenses. For purposes of comparison, operating income (loss) for the
fiscal year ended March 2011 has been revised using the new standard. Operating income (loss) for the fiscal year ended March 2010 was based on the old method.
Financial Section ........................................................... 24
Management’s Discussion and Analysis ............................ 24
Consolidated Balance Sheets ............................................. 30
Consolidated Statements of Operations ............................ 32
Consolidated Statement of Comprehensive Income ......... 33
Consolidated Statements of Changes in Equity ................. 34
Consolidated Statements of Cash Flows ........................... 35
Notes to Consolidated Financial Statements .................... 36
Independent Auditors’ Report ............................................ 58
Organization of the Nikon Group .................................. 59
Nikon Group Companies ............................................... 60
Directors, Auditors and Officers ................................... 62
Investor Information ...................................................... 63
2010 2011 2012
0 0
200,000 20,000
400,000 40,000
600,000 60,000
■ Net Sales (Left scale) ■ Operating Income (Right scale)
(Millions of yen)
Net Sales and Operating Income
Years ended March 31
■ Net Sales (Left scale) ■ Operating Loss (Right scale)
-10,000
-5,000
0 0
20,000 5,000
40,000 10,000
2010 2011 2012
(Millions of yen)
Net Sales and Operating Income (Loss)
Years ended March 31
■ Net Sales (Left scale) ■ Operating Income (Loss) (Right scale)
2010 2011 2012
200,000 40,000
150,000 30,000
100,000 20,000
50,000 10,000
0 0
-50,000
-60,000
(Millions of yen)
Net Sales and Operating Income (Loss)
Years ended March 31