NVIDIA 2009 Annual Report Download - page 91
Download and view the complete annual report
Please find page 91 of the 2009 NVIDIA annual report below. You can navigate through the pages in the report by either clicking on the pages listed below, or by using the keyword search tool below to find specific information within the annual report.-
 1
1 -
2
-
3
-
4
-
5
-
6
-
7
-
8
-
9
-
10
-
11
-
12
-
13
-
14
-
15
-
16
-
17
-
18
-
19
-
20
-
21
-
22
-
23
-
24
-
25
-
26
-
27
-
28
-
29
-
30
-
31
-
32
-
33
-
34
-
35
-
36
-
37
-
38
-
39
-
40
-
41
-
42
-
43
-
44
-
45
-
46
-
47
-
48
-
49
-
50
-
51
-
52
-
53
-
54
-
55
-
56
-
57
-
58
-
59
-
60
-
61
-
62
-
63
-
64
-
65
-
66
-
67
-
68
-
69
-
70
-
71
-
72
-
73
-
74
-
75
-
76
-
77
-
78
-
79
-
80
-
 81
81 -
 82
82 -
 83
83 -
 84
84 -
 85
85 -
 86
86 -
 87
87 -
 88
88 -
 89
89 -
 90
90 -
 91
91 -
 92
92 -
 93
93 -
 94
94 -
 95
95 -
 96
96 -
 97
97 -
 98
98 -
 99
99 -
 100
100 -
 101
101 -
102
-
103
-
104
-
105
-
106
-
107
-
108
-
109
-
110
-
111
-
112
-
113
-
114
-
115
-
116
-
117
-
118
-
119
-
120
-
121
-
122
-
123
-
124
-
125
-
126
-
127
-
128
-
129
-
130
-
131
-
132
-
133
-
134
-
135
-
136
-
137
-
138
-
139
-
140
-
141
 |
 |

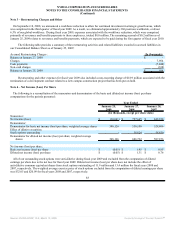
NVIDIA CORPORATION AND SUBSIDIARIES
NOTES TO THE CONSOLIDATED FINANCIAL STATEMENTS
(Continued)
Inventories
Inventory cost is computed on an adjusted standard basis, which approximates actual cost on an average or first-in, first-out
basis. Inventory costs consist primarily of the cost of semiconductors purchased from subcontractors, including wafer fabrication,
assembly, testing and packaging, manufacturing support costs, including labor and overhead associated with such purchases, final test
yield fallout, inventory provisions and shipping costs. We write down our inventory for estimated amounts related to lower of cost or
market, obsolescence or unmarketable inventory equal to the difference between the cost of inventory and the estimated market value
based upon assumptions about future demand, future product purchase commitments, estimated manufacturing yield levels and market
conditions. If actual market conditions are less favorable than those projected by management, or if our future product purchase
commitments to our suppliers exceed our forecasted future demand for such products, additional future inventory write-downs may be
required that could adversely affect our operating results. If actual market conditions are more favorable, we may have higher gross
margins when products are sold. Sales to date of such products have not had a significant impact on our gross margin. Inventory
reserves once established are not reversed until the related inventory has been sold or scrapped.
Property and Equipment
Property and equipment are stated at cost. Depreciation of property and equipment is computed using the straight-line method
based on the estimated useful lives of the assets, generally three to five years. The estimated useful lives of our buildings have
estimated useful lives of up to twenty-five years. Depreciation expense includes the amortization of assets recorded under capital
leases. Leasehold improvements and assets recorded under capital leases are amortized over the shorter of the lease term or the
estimated useful life of the asset.
Goodwill
We account for goodwill in accordance with Statement of Financial Accounting Standards No. 142, or SFAS No. 142,
Goodwill and Other Intangible Assets. Goodwill is subject to our annual impairment test during the fourth quarter of our fiscal year, or
earlier if indicators of potential impairment exist, using a fair value-based approach. Our impairment review process compares the fair
value of the reporting unit in which the goodwill resides to its carrying value. For the purposes of completing our SFAS
No. 142 impairment test, we perform our analysis on a reporting unit basis. We utilize a two-step approach to testing goodwill for
impairment. The first step tests for possible impairment by applying a fair value-based test. In computing fair value of our reporting
units, we use estimates of future revenues, costs and cash flows from such units. The second step, if necessary, measures the amount
of such impairment by applying fair value-based tests to individual assets and liabilities.
Intangible Assets
Intangible assets primarily represent rights acquired under technology licenses, patents, acquired intellectual property,
trademarks and customer relationships. We currently amortize our intangible assets with definitive lives over periods ranging from
one to ten years using a method that reflects the pattern in which the economic benefits of the intangible asset are consumed or
otherwise used up or, if that pattern can not be reliably determined, using a straight-line amortization method.
Impairment of Long-Lived Assets
In accordance with Statement of Financial Accounting Standards No. 144, or SFAS No. 144, Accounting for the Impairment or
Disposal of Long-Lived Assets, long-lived assets, such as property and equipment and intangible assets subject to amortization, are
reviewed for impairment whenever events or changes in circumstances indicate that the carrying amount of an asset may not be
recoverable. Recoverability of assets to be held and used is measured by a comparison of the carrying amount of an asset to estimated
undiscounted future cash flows expected to be generated by the asset. If the carrying amount of an asset exceeds its estimated future
cash flows, an impairment charge is recognized for the amount by which the carrying amount of the asset exceeds the fair value of the
asset. Fair value is determined based on the estimated discounted future cash flows expected to be generated by the asset. Assets and
liabilities to be disposed of would be separately presented in the consolidated balance sheet and the assets would be reported at the
lower of the carrying amount or fair value less costs to sell, and would no longer be depreciated.
76
Source: NVIDIA CORP, 10-K, March 13, 2009 Powered by Morningstar® Document Research℠