NVIDIA 2009 Annual Report Download - page 60
Download and view the complete annual report
Please find page 60 of the 2009 NVIDIA annual report below. You can navigate through the pages in the report by either clicking on the pages listed below, or by using the keyword search tool below to find specific information within the annual report.-
 1
1 -
2
-
3
-
4
-
5
-
6
-
7
-
8
-
9
-
10
-
11
-
12
-
13
-
14
-
15
-
16
-
17
-
18
-
19
-
20
-
21
-
22
-
23
-
24
-
25
-
26
-
27
-
28
-
29
-
30
-
31
-
32
-
33
-
34
-
35
-
36
-
37
-
38
-
39
-
40
-
41
-
42
-
43
-
44
-
45
-
46
-
47
-
48
-
49
-
 50
50 -
 51
51 -
 52
52 -
 53
53 -
 54
54 -
 55
55 -
 56
56 -
 57
57 -
 58
58 -
 59
59 -
 60
60 -
 61
61 -
 62
62 -
 63
63 -
 64
64 -
 65
65 -
 66
66 -
 67
67 -
 68
68 -
 69
69 -
 70
70 -
71
-
72
-
73
-
74
-
75
-
76
-
77
-
78
-
79
-
80
-
81
-
82
-
83
-
84
-
85
-
86
-
87
-
88
-
89
-
90
-
91
-
92
-
93
-
94
-
95
-
96
-
97
-
98
-
99
-
100
-
101
-
102
-
103
-
104
-
105
-
106
-
107
-
108
-
109
-
110
-
111
-
112
-
113
-
114
-
115
-
116
-
117
-
118
-
119
-
120
-
121
-
122
-
123
-
124
-
125
-
126
-
127
-
128
-
129
-
130
-
131
-
132
-
133
-
134
-
135
-
136
-
137
-
138
-
139
-
140
-
141
 |
 |

Litigation, Investigation and Settlement Costs
From time to time, we are involved in legal actions and/or investigations by regulatory bodies. We are aggressively defending our
current litigation matters for which we are responsible. However, there are many uncertainties associated with any litigation or
investigations, and we cannot be certain that these actions or other third-party claims against us will be resolved without costly
litigation, fines and/or substantial settlement payments. If that occurs, our business, financial condition and results of operations could
be materially and adversely affected. If information becomes available that causes us to determine that a loss in any of our pending
litigation, investigations or settlements is probable, and we can reasonably estimate the loss associated with such events, we will
record the loss in accordance with accounting principles generally accepted in the United States. However, the actual liability in any
such litigation or investigations may be materially different from our estimates, which could require us to record additional costs.
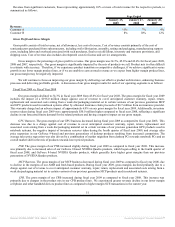
Results of Operations
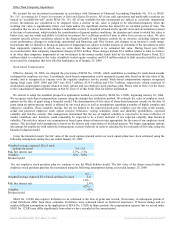
The following table sets forth, for the periods indicated, certain items in our consolidated statements of operations expressed as a
percentage of revenue.
Year Ended
January 25,
2009
January
27, 2008
January
28, 2007
Revenue 100.0 % 100.0% 100.0%
Cost of revenue 65.7 54.4 57.6
Gross profit 34.3 45.6 42.4
Operating expenses:
Research and development 25.0 16.9 18.0
Sales, general and administrative 10.6 8.3 9.6
Restructuring charges and other 0.8 - -
Total operating expenses 36.4 25.2 27.6
Income (loss) from operations (2.1) 20.4 14.8
Interest and other income, net 0.8 1.6 1.3
Income (loss) before income taxes (1.3) 22.0 16.1
Income tax expense (benefit) (0.4) 2.5 1.5
Net income (loss) (0.9)% 19.5% 14.6%
Fiscal Years Ended January 25, 2009, January 27, 2008 and January 28, 2007
Revenue
We report financial information for four major product-line operating segments to our Chief Executive Officer, who is considered
to be our chief operating decision maker, as follows: the GPU business, PSB, MCP business, and CPB. Revenue in the "All Other"
category is primarily derived from sales of components. Please refer to Note 16 of our Notes to the Consolidated Financial Statements
in Part IV, Item 15 of this Form 10-K for further information.
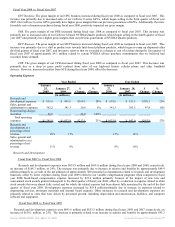
Fiscal Year 2009 vs. Fiscal Year 2008
Revenue was $3.42 billion for fiscal year 2009, compared to $4.10 billion for fiscal year 2008, which represents a decrease of
16%. For the first quarter of fiscal 2010, we expect revenue to remain flat or improve slightly when compared to the fourth quarter of
fiscal year 2009. A discussion of our revenue results for each of our operating segments is as follows:
GPU Business. GPU business revenue decreased by 24% to $1.91 billion for fiscal year 2009, compared to $2.52 billion for
fiscal year 2008. This decrease resulted from decreased sales of our desktop GPU and memory products, offset by increased sales of
our notebook GPU products. Sales of our desktop GPU and memory products decreased approximately 29% and 59%, respectively, in
fiscal year 2009 when compared to fiscal year 2008. These decreases were primarily due to a decline in the Standalone Desktop
market segment as reported in the December 2008 PC Graphics Report from Mercury Research, driven by a combination of market
migration from desktop PCs towards notebook PCs and an overall market shift in the mix of products towards lower priced products.
This overall market decline translated into a decline of over 20% in the number of units of desktop GPU products that we sold in fiscal
year 2009 compared to fiscal year 2008. The decline in desktop GPU revenue also reflects the impact of a slight average sales price
regression in our products and a decline in our share position during the middle portion of fiscal year 2009 as a result of increased
competition. Memory sales declined as a result of a decline in sales of our high-end desktop GPU products. Sales of our notebook
GPU products increased approximately 3% in fiscal year 2009 when compared to fiscal year 2008, due to higher unit sales aided by a
market move toward notebook PCs over desktop PCs, offset by a slight decline in average selling prices. Additionally, the overall
global economic recessionary climate contributed to a significant decline in the demand for total graphics during the fourth quarter of
fiscal year 2009.
49
Source: NVIDIA CORP, 10-K, March 13, 2009 Powered by Morningstar® Document Research℠