NVIDIA 2009 Annual Report Download - page 105
Download and view the complete annual report
Please find page 105 of the 2009 NVIDIA annual report below. You can navigate through the pages in the report by either clicking on the pages listed below, or by using the keyword search tool below to find specific information within the annual report.-
 1
1 -
2
-
3
-
4
-
5
-
6
-
7
-
8
-
9
-
10
-
11
-
12
-
13
-
14
-
15
-
16
-
17
-
18
-
19
-
20
-
21
-
22
-
23
-
24
-
25
-
26
-
27
-
28
-
29
-
30
-
31
-
32
-
33
-
34
-
35
-
36
-
37
-
38
-
39
-
40
-
41
-
42
-
43
-
44
-
45
-
46
-
47
-
48
-
49
-
50
-
51
-
52
-
53
-
54
-
55
-
56
-
57
-
58
-
59
-
60
-
61
-
62
-
63
-
64
-
65
-
66
-
67
-
68
-
69
-
70
-
71
-
72
-
73
-
74
-
75
-
76
-
77
-
78
-
79
-
80
-
81
-
82
-
83
-
84
-
85
-
86
-
87
-
88
-
89
-
90
-
91
-
92
-
93
-
94
-
 95
95 -
 96
96 -
 97
97 -
 98
98 -
 99
99 -
 100
100 -
 101
101 -
 102
102 -
 103
103 -
 104
104 -
 105
105 -
 106
106 -
 107
107 -
 108
108 -
 109
109 -
 110
110 -
 111
111 -
 112
112 -
 113
113 -
 114
114 -
 115
115 -
116
-
117
-
118
-
119
-
120
-
121
-
122
-
123
-
124
-
125
-
126
-
127
-
128
-
129
-
130
-
131
-
132
-
133
-
134
-
135
-
136
-
137
-
138
-
139
-
140
-
141
 |
 |

NVIDIA CORPORATION AND SUBSIDIARIES
NOTES TO THE CONSOLIDATED FINANCIAL STATEMENTS
(Continued)
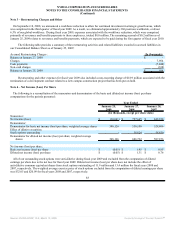
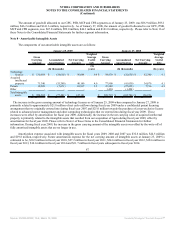
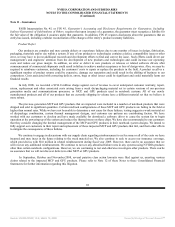
The amount of goodwill allocated to our GPU, PSB, MCP and CPB segments as of January 25, 2009, was $86.9 million, $95.1
million, $46.2 million and $141.6 million, respectively. As of January 27, 2008, the amount of goodwill allocated to our GPU, PSB,
MCP and CPB segments, was $67.8 million, $99.0 million, $46.3 million and $141.0 million, respectively. Please refer to Note 16 of
these Notes to the Consolidated Financial Statements for further segment information.
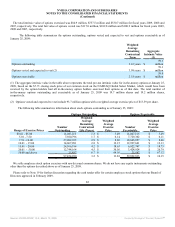
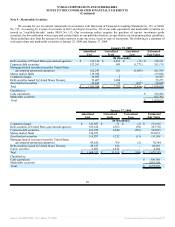
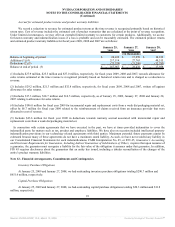
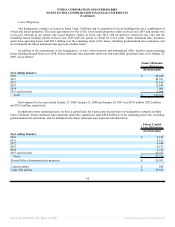
Note 8 - Amortizable Intangible Assets
The components of our amortizable intangible assets are as follows:
January 25, 2009 January 27, 2008
Gross
Carrying
Amount
Accumulated
Amortization
Net Carrying
Amount
Weighted
Average
Useful
Life
Gross
Carrying
Amount
Accumulated
Amortization
Net Carrying
Amount
Weighted
Average
Useful
Life
(In thousands)
(In
years) (In thousands) (In years)
Technology
licenses $ 130,654 $ (34,610) $ 96,044 9.4 $ 94,970 $ (32,630) $ 62,340 9.1
Acquired
intellectual
property 75,340 (35,200) 40,140 4.0 77,900 (41,030) 36,870 4.1
Patents 18,588 (7,671) 10,917 5.3 35,348 (27,632) 7,716 4.3
Other - - - - 1,494 (1,494) - -
Total intangible
assets $ 224,582 $ (77,481) $ 147,101 $ 209,712 $ (102,786) $ 106,926
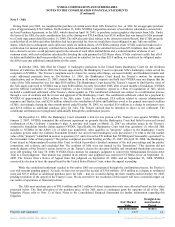
The increase in the gross carrying amount of technology licenses as of January 25, 2009 when compared to January 27, 2008 is
primarily related to approximately $21.8 million of net cash outflows during fiscal year 2009 under a confidential patent licensing
arrangement that we originally entered into during fiscal year 2007 and $25.0 million towards the purchase of a non-exclusive license
related to advanced power management and other computing technologies that we entered into during fiscal year 2009. These
increases were offset by amortization for fiscal year 2009. Additionally, the increase in the net carrying value of acquired intellectual
property is primarily related to the intangible assets that resulted from our acquisition of Ageia during fiscal year 2009, offset by
amortization for fiscal year 2009. Please refer to Note 6 of these Notes to the Consolidated Financial Statements for further
information. During fiscal year 2009, the increase in the gross carrying amount of the intangible assets was offset by the write-off of
fully amortized intangible assets that are no longer in use.
Amortization expense associated with intangible assets for fiscal years 2009, 2008 and 2007 was $32.6 million, $24.5 million
and $19.8 million, respectively. Future amortization expense for the net carrying amount of intangible assets at January 25, 2009 is
estimated to be, $30.9 million in fiscal year 2010, $27.2 million in fiscal year 2011, $24.6 million in fiscal year 2012, $18.6 million in
fiscal year 2013, $14.1million in fiscal year 2014 and $31.7 million in fiscal years subsequent to fiscal year 2014.
87
Source: NVIDIA CORP, 10-K, March 13, 2009 Powered by Morningstar® Document Research℠