NVIDIA 2009 Annual Report Download - page 69
Download and view the complete annual report
Please find page 69 of the 2009 NVIDIA annual report below. You can navigate through the pages in the report by either clicking on the pages listed below, or by using the keyword search tool below to find specific information within the annual report.
Liquidity
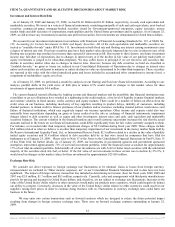
Our primary source of liquidity is cash generated by our operations. Our investment portfolio consisted of cash and cash
equivalents, asset-backed securities, commercial paper, mortgage-backed securities issued by government-sponsored enterprises,
equity securities, money market funds and debt securities of corporations, municipalities and the United States government and its
agencies. These investments are denominated in United States dollars. As of January 25, 2009, we did not have any investments in
auction-rate preferred securities.
We account for our investment instruments in accordance with Statement of Financial Accounting Standards No. 115, or SFAS
No. 115, Accounting for Certain Investments in Debt and Equity Securities. All of the cash equivalents and marketable securities are
treated as “available-for-sale” under SFAS No. 115. Investments in both fixed rate and floating rate interest earning instruments carry
a degree of interest rate risk. Fixed rate debt securities may have their market value adversely impacted due to a rise in interest rates,
while floating rate securities may produce less income than expected if interest rates fall. Due in part to these factors, our future
investment income may fall short of expectations due to changes in interest rates or if the decline in fair value of our publicly traded
debt or equity investments is judged to be other-than-temporary. We may suffer losses in principal if we are forced to sell securities
that decline in market value due to changes in interest rates. However, because any debt securities we hold are classified as
“available-for-sale,” no gains or losses are realized in our statement of operations due to changes in interest rates unless such securities
are sold prior to maturity or unless declines in market values are determined to be other-than-temporary. These securities are reported
at fair value with the related unrealized gains and losses included in accumulated other comprehensive income, a component of
stockholders’ equity, net of tax.
As of January 25, 2009 and January 27, 2008, we had $1.26 billion and $1.81 billion, respectively, in cash, cash equivalents
and marketable securities. Our investment policy requires the purchase of top-tier investment grade securities, the diversification of
asset types and includes certain limits on our portfolio duration, as specified in our investment policy guidelines. These guidelines also
limit the amount of credit exposure to any one issue, issuer or type of instrument. As of January 25, 2009, we were in compliance with
our investment policy. As of January 25, 2009, our investments in government agencies and government sponsored enterprises
represented approximately 71% of our total investment portfolio, while the financial sector, which has been negatively impacted by
recent market liquidity conditions, accounted for approximately 17% of our total investment portfolio. Substantially all of our
investments are with A/A2 or better rated securities with the substantial majority of the securities rated AA-/Aa3 or better.
We performed an impairment review of our investment portfolio as of January 25, 2009. Currently, we have the intent and
ability to hold our investments with impairment indicators until maturity. Based on our quarterly impairment review and having
considered the guidance in Statement of Financial Accounting Standards Staff Position No. 115-1, or FSP No. 115-1, A Guide to the
Implementation of Statement 115 on Accounting for Certain Investments in Debt and Equity Securities, we recorded other than
temporary impairment charges of $9.9 million during fiscal year 2009. These charges include $5.6 million related to what we believe
is an other than temporary impairment of our investment in the money market funds held by the Reserve International Liquidity Fund,
Ltd., or International Reserve Fund; $2.5 million related to a decline in the value of publicly traded equity securities and $1.8 million
related to debt securities held by us that were issued by companies that have filed for bankruptcy as of January 25, 2009. Please refer
to Note 17 of the Notes to the Consolidated Financial Statements in Part IV, Item 15 of this Form 10-K for further details. We
concluded that our investments were appropriately valued and that except for the $9.9 million impairment charges recognized in the
year, no other than temporary impairment charges were necessary on our portfolio of available for sale investments as of January 25,
2009.
Net realized gains (losses), excluding any impairment charges, for fiscal year 2009 was $2.1 million. Net realized gains (losses)
for fiscal years 2008 and 2007 were not material. As of January 25, 2009, we had a net unrealized gain of $4.4 million, which was
comprised of gross unrealized gains of $7.8 million, offset by $3.4 million of gross unrealized losses. As of January 27, 2008, we had
a net unrealized gain of $10.7 million, which was comprised of gross unrealized gains of $11.1 million, offset by $0.4 million of gross
unrealized losses.
As of January 25, 2009, our money market investment in the International Reserve Fund, which was valued at $124.4 million,
net of other than temporary impairment charges, was classified as marketable securities in our Consolidated Balance Sheet due to the
halting of redemption requests in September 2008 by the International Reserve Fund. Subsequent to year-end, on January 30, 2009,
we received $84.4 million from the International Reserve Fund. This was our portion of a payout of approximately 65% of the total
assets of the Fund. Each shareholder’s percentage of this distribution was determined by dividing the shareholder’s total unfunded
redeemed shares by the aggregate unfunded redeemed shares of the Fund, which was then used to calculate the shareholder’s pro rata
portion of this distribution. We expect to receive the proceeds of our remaining investment in the International Reserve Fund,
excluding the $5.6 million that we have recorded as an other than temporary impairment, by no later than October 2009, when all of
the underlying securities held by the International Reserve Fund are scheduled to have matured. However, redemptions from the
International Reserve Fund are currently subject to pending litigation, which could cause further delay in receipt of our funds.
56
Source: NVIDIA CORP, 10-K, March 13, 2009 Powered by Morningstar® Document Research℠


