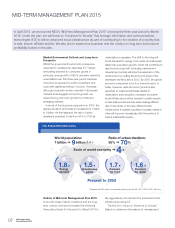
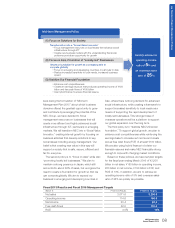
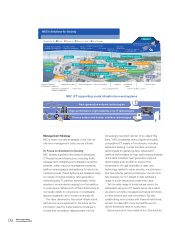
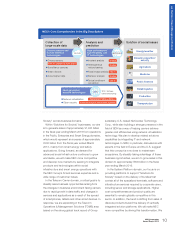
NEC 2013 Annual Report Download - page 17
Download and view the complete annual report
Please find page 17 of the 2013 NEC annual report below. You can navigate through the pages in the report by either clicking on the pages listed below, or by using the keyword search tool below to find specific information within the annual report.
4,000.0
2,000.0
6,000.0
2009
22.2%
19.9%
15.4%
15.7%
15.9%
2010 2011
4,215.6
2012
3,583.1
3,115.4 3,036.8
3,071.6
2013
0
150.0
50.0
100.0
0
–0.1%
1.4% 1.9%
2.4%
–6.2
50.9
73.7
57.8
–50.0 2009 2010 2011 2012 2013
114.6
3.7%
–7.0%
0.3%
–0.4%
–3.6%
–296.6
11.4
2009 2010 2011 2012 2013
30.4
1.0%
–300.0
0
20.0
40.0
–12.5
–110.3
300.0
600.0
900.0
2009 2010 2011 2012 2013
0
20.9%
26.9%
28.8%
25.7%
641.7
790.9 757.1
657.0
27.5%
710.7
50.0
100.0
150.0
2009 2010 2011 2012
45.6
2013
103.1
83.1
52.9
42.0
0
150.0
100.0
50.0
0
27.4
–173.2
134.8
–41.2
33.7
–146.2
–200.0
–112.6
83.9
–49.7
34.2
–145.8
93.6
2009 2010 2011 2012 2013
143.7
42.0
–101.7
40
20
60
2009
33.3 33.3 33.3
45.5
38.5
2010 2011 2012 2013
0
1,000
2,000
3,000
2009 2010 2011 2012 2013
0
1,890 1,900
2,120 2,310
2,980
Millions of
U.S.dollars Percent change
2013/2012
2013 2013
¥3,071,609 $32,677 1.1%
483,118 5,140 0.3
15.7
114,647 1,220 55.5
92,024 979 118.8
30,434 324 –
143,748 1,529 71.4
(101,742) (1,082) –
42,006 447 23.0
151,676 1,614 –6.4
45,614 485 8.7
51,167 544 –4.0
11.71 0.12 –
– – –
4.00 0.04 –
2,580,966 27,457 0.9
710,666 7,560 8.2
4.5
27.5
603,451 6,420 –12.9
0.85
270
2013
Percent change
2013/2012
102,375
45.5
84
2,980 29.0
64
–
76
389
7,670
CAPITAL EXPENDITURES
(Billion ¥)
CASH FLOWS
(Billion ¥)
RATIO OF OUTSIDE DIRECTORS TO
ALL DIRECTORS
(%)
CO2 EMISSIONS REDUCTION BY
PROVIDING IT SOLUTIONS
(Thousand tons)
Cash flows from operating activities
Cash flows from investing activities
Free cash flows
Net sales
Percentage of overseas sales to
consolidated net sales
Net income (loss)
Net income ratio
OWNER’S EQUITY,
OWNER’S EQUITY RATIO
(Billion ¥)
Owner’s equity
Owner’s equity ratio
Operating income (loss)
Operating income ratio
NET SALES, PERCENTAGE OF OVERSEAS
SALES TO CONSOLIDATED NET SALES
(Billion ¥)
OPERATING INCOME (LOSS),
OPERATING INCOME RATIO
(Billion ¥)
NET INCOME (LOSS),
NET INCOME RATIO
(Billion ¥)
(At year-end)
16
NEC Corporation
Annual Report 2013
I
Business Report/Management Policies


