Morgan Stanley 2001 Annual Report Download - page 5
Download and view the complete annual report
Please find page 5 of the 2001 Morgan Stanley annual report below. You can navigate through the pages in the report by either clicking on the pages listed below, or by using the keyword search tool below to find specific information within the annual report.-
 1
1 -
 2
2 -
 3
3 -
 4
4 -
 5
5 -
 6
6 -
 7
7 -
 8
8 -
 9
9 -
 10
10 -
 11
11 -
 12
12 -
 13
13 -
 14
14 -
 15
15 -
 16
16 -
17
-
18
-
19
-
20
-
21
-
22
-
23
-
24
-
25
-
26
-
27
-
28
-
29
 |
 |

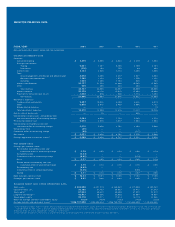
FINANCIAL RESULTS
>Our net income for fiscal year 2001 was $3.6 billion, a
decline of 34 percent from last year’s record $5.5 billion.
Earnings per share were $3.19, down 33 percent from
$4.73 a year ago.
>Return on equity (ROE) for the year was 19 percent, which
is very strong considering the difficult environment in the
securities industry. We believe the two principal reasons
for this strong ROE are our discipline in controlling
expenses and the breadth and diversity of our busi-
nesses, several of which had excellent results despite the
generally difficult environment.
>Net income in our securities segment was down 42 per-
cent from $4 billion in 2000 to $2.4 billion this past year.
Fixed income, however, was the exception within the
securities segment, with a record year in net revenues.
Our equities business also continued to deliver high
returns, even though volume was down from the peaks of
the first half of 2000. Both investment banking and the
individual investor group suffered significant decreases
in net revenues.
>Our investment management business was down 19 per-
cent in net income, but our investor base remained solid,
and the business continued to produce high returns.
>Credit services net income was roughly equal to last year
at $702 million, resulting in 19 percent ROE.
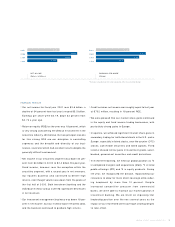
>We were pleased that our market share gains continued
in the equity and fixed income trading businesses, with
particularly strong gains in Europe.
>In equities, we achieved significant market share gains in
secondary trading for institutional clients in the U.S. and in
Europe, especially in listed stocks, over-the-counter (OTC)
stocks, convertible securities and listed options. Fixed
income showed similar gains in investment grade, asset-
backed, government securities and credit derivatives.
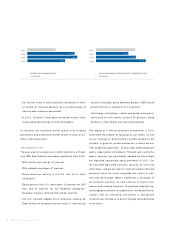
>In investment banking, we held our global position as #2
in completed mergers and acquisitions (M&A), #2 in initial
public offerings (IPO) and #3 in equity products. During
the year, we reorganized the division, repositioning our
resources to allow for more client coverage while reduc-
ing headcount by more than 10 percent. Despite
increased competitive pressure from commercial
banks, we were able to maintain our market position in
investment banking. We are intent on improving that
leadership position over the next several years as the
impact of our reoriented client coverage strategy begins
to take effect.
2001
2000
1999
1998
5,456
3,521
4,791
3,276
2001
2000
1999
1998
4.73
*3.19
4.10
2.67
NET INCOME
(Dollars in Millions)
EARNINGS PER SHARE
(Diluted)
*Excludes extraordinary item and cumulative effect of accounting change.
MORGAN STANLEY ANNUAL REPORT 2001 3