Morgan Stanley 2001 Annual Report Download - page 4
Download and view the complete annual report
Please find page 4 of the 2001 Morgan Stanley annual report below. You can navigate through the pages in the report by either clicking on the pages listed below, or by using the keyword search tool below to find specific information within the annual report.-
 1
1 -
 2
2 -
 3
3 -
 4
4 -
 5
5 -
 6
6 -
 7
7 -
 8
8 -
 9
9 -
 10
10 -
 11
11 -
 12
12 -
 13
13 -
 14
14 -
 15
15 -
16
-
17
-
18
-
19
-
20
-
21
-
22
-
23
-
24
-
25
-
26
-
27
-
28
-
29
 |
 |

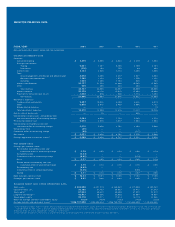
SELECTED FINANCIAL DATA
FISCAL YEAR(1) 2001 2000 1999 1998 1997
(DOLLARS IN MILLIONS, EXCEPT SHARE AND PER SHARE DATA)
INCOME STATEMENT DATA
Revenues:
Investment banking $ 3,415 $ 5,008 $ 4,523 $ 3,339 $ 2,694
Principal transactions:
Trading 5,501 7,361 5,796 3,159 3,191
Investments (316) 193 725 89 463
Commissions 3,153 3,645 2,774 2,208 2,066
Fees:
Asset management, distribution and administration 4,078 4,286 3,377 3,041 2,554
Merchant and cardmember 1,345 1,323 1,074 1,236 1,351
Servicing 1,904 1,450 1,194 928 762
Interest and dividends 24,127 21,234 14,880 16,385 13,583
Other 520 485 244 284 144
Total revenues 43,727 44,985 34,587 30,669 26,808
Interest expense 20,779 18,176 12,515 13,463 10,806
Provision for consumer loan losses 1,052 810 526 1,174 1,493
Net revenues 21,896 25,999 21,546 16,032 14,509
Non-interest expenses:
Compensation and benefits 9,397 10,936 8,398 6,636 6,019
Other 6,815 6,572 5,420 4,696 4,142
Merger-related expenses ——— —74
Total non-interest expenses 16,212 17,508 13,818 11,332 10,235
Gain on sale of businesses —35 — 685 —
Income before income taxes, extraordinary item
and cumulative effect of accounting change 5,684 8,526 7,728 5,385 4,274
Provision for income taxes 2,074 3,070 2,937 1,992 1,688
Income before extraordinary item and
cumulative effect of accounting change 3,610 5,456 4,791 3,393 2,586
Extraordinary item (30) ————
Cumulative effect of accounting change (59) — — (117) —
Net income $ 3,521 $ 5,456 $ 4,791 $ 3,276 $ 2,586
Earnings applicable to common shares(2) $ 3,489 $ 5,420 $ 4,747 $ 3,221 $ 2,520
PER SHARE DATA
Earnings per common share:
Basic before extraordinary item and
cumulative effect of accounting change $ 3.29 $ 4.95 $ 4.33 $ 2.90 $ 2.19
Extraordinary item (0.03) ————
Cumulative effect of accounting change (0.05) — — (0.10) —
Basic $ 3.21 $ 4.95 $ 4.33 $ 2.80 $ 2.19
Diluted before extraordinary item and
cumulative effect of accounting change $ 3.19 $ 4.73 $ 4.10 $ 2.76 $ 2.08
Extraordinary item (0.03) ————
Cumulative effect of accounting change (0.05) — — (0.09) —
Diluted $ 3.11 $ 4.73 $ 4.10 $ 2.67 $ 2.08
Book value per common share $ 18.64 $ 16.91 $ 14.85 $ 11.94 $ 11.06
Dividends per common share $ 0.92 $ 0.80 $ 0.48 $ 0.40 $ 0.28
BALANCE SHEET AND OTHER OPERATING DATA
Total assets $ 482,628 $ 421,279 $ 366,967 $ 317,590 $ 302,287
Consumer loans, net 20,108 21,743 20,963 16,412 21,347
Total capital(3) 61,633 49,637 39,699 37,922 33,577
Long-term borrowings(3) 40,917 30,366 22,685 23,803 19,621
Shareholders’ equity 20,716 19,271 17,014 14,119 13,956
Return on average common shareholders’ equity 18.5% 30.9% 32.6% 24.5% 22.0%
Average common and equivalent shares(2) 1,086,121,508 1,095,858,438 1,096,789,720 1,151,645,450 1,149,636,466
(1) This information should be read in conjunction with the Company’s Consolidated Financial Statements and the Notes thereto contained in the Company’s Annual Report on Form 10-K for the fiscal year
ended November 30, 2001, copies of which are available at www.morganstanley.com or upon request. Certain prior-period information has been reclassified to conform to the current year’s presentation.
(2) Amounts shown are used to calculate basic earnings per common share.
(3) These amounts exclude the current portion of long-term borrowings and include Capital Units and Preferred Securities Issued by Subsidiaries.