Morgan Stanley 2000 Annual Report Download - page 4
Download and view the complete annual report
Please find page 4 of the 2000 Morgan Stanley annual report below. You can navigate through the pages in the report by either clicking on the pages listed below, or by using the keyword search tool below to find specific information within the annual report.-
 1
1 -
 2
2 -
 3
3 -
 4
4 -
 5
5 -
 6
6 -
 7
7 -
 8
8 -
 9
9 -
 10
10 -
 11
11 -
 12
12 -
 13
13 -
 14
14 -
 15
15 -
16
-
17
-
18
-
19
-
20
-
21
-
22
-
23
-
24
 |
 |

(1)
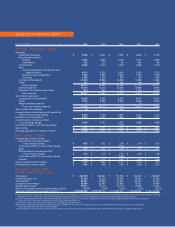
FISCAL YEAR(2) (DOLLARS IN MILLIONS, EXCEPT SHARE AND PER SHARE DATA) 2000 1999 1998 1997 1996
Revenues:
Investment banking $ 5,008 $ 4,523 $ 3,340 $ 2,694 $ 2,190
Principal transactions:
Trading 7,393 5,830 3,159 3,191 2,659
Investments 193 725 89 463 86
Commissions 3,645 2,774 2,208 2,066 1,776
Fees:
Asset management, distribution and
administration 4,219 3,324 3,003 2,525 1,732
Merchant and cardmember 1,780 1,492 1,647 1,704 1,505
Servicing 1,450 1,194 928 762 809
Interest and dividends 21,234 14,880 16,386 13,583 11,288
Other 491 248 282 144 126
Total revenues 45,413 34,990 31,042 27,132 22,171
Interest expense 18,176 12,515 13,464 10,806 8,934
Provision for consumer loan losses 810 529 1,173 1,493 1,214
Net revenues 26,427 21,946 16,405 14,833 12,023
Non-interest expenses:
Compensation and benefits 10,936 8,398 6,636 6,019 5,071
Other 7,000 5,820 5,069 4,466 3,835
Merger-related expenses — — — 74 —
Total non-interest expenses 17,936 14,218 11,705 10,559 8,906
Gain on sale of businesses 35 — 685 — —
Income before income taxes and cumulative
effect of accounting change 8,526 7,728 5,385 4,274 3,117
Provision for income taxes 3,070 2,937 1,992 1,688 1,137
Income before cumulative effect
of accounting change 5,456 4,791 3,393 2,586 1,980
Cumulative effect of accounting change — — (117) — —
Net income $ 5,456 $ 4,791 $ 3,276 $ 2,586 $ 1,980
Earnings applicable to common shares(3) $ 5,420 $ 4,747 $ 3,221 $ 2,520 $ 1,914
(4)
Earnings per common share:
Basic before cumulative effect
of accounting change $ 4.95 $ 4.33 $ 2.90 $ 2.19 $ 1.67
Cumulative effect of accounting change — — (0.10) — —
Basic $ 4.95 $ 4.33 $ 2.80 $ 2.19 $ 1.67
Diluted before cumulative effect
of accounting change $ 4.73 $ 4.10 $ 2.76 $ 2.08 $ 1.58
Cumulative effect of accounting change — — (0.09) — —
Diluted $ 4.73 $ 4.10 $ 2.67 $ 2.08 $ 1.58
Book value per common share $ 16.91 $ 14.85 $ 11.94 $ 11.06 $ 9.22
Dividends per common share $ 0.80 $ 0.48 $ 0.40 $ 0.28 $ 0.22
Total assets $ 426,794 $ 366,967 $ 317,590 $ 302,287 $ 238,860
Consumer loans, net 21,090 20,229 15,209 20,033 21,262
Total capital(5) 49,637 39,699 37,922 33,577 31,152
Long-term borrowings(5) 30,366 22,685 23,803 19,621 19,450
Shareholders’ equity 19,271 17,014 14,119 13,956 11,702
Return on average common shareholders’ equity 30.9% 32.6% 24.5% 22.0% 20.0%
Average common and equivalent shares(3)(4) 1,095,858,438 1,096,789,720 1,151,645,450 1,149,636,466 1,146,713,860
(1) This information should be read in conjunction with the Company’s Consolidated Financial Statements and the Notes thereto contained in the Company’s Annual
Report on Form 10-K for the year ended November 30, 2000, copies of which are available at www.msdw.com/ar2000 or upon request.
(2) Fiscal 1996 represents the combination of Morgan Stanley Group Inc.’s financial statements for the fiscal year ended November 30 with Dean Witter,
Discover & Co.’s financial statements for the year ended December 31.
(3) Amounts shown are used to calculate basic earnings per common share.
(4) Amounts have been retroactively adjusted to give effect for a two-for-one common stock split, effected in the form of a 100% stock dividend,
which became effective on January 26, 2000.
(5) These amounts exclude the current portion of long-term borrowings and include Capital Units and Preferred Securities Issued by Subsidiaries.