Morgan Stanley 1999 Annual Report Download - page 6
Download and view the complete annual report
Please find page 6 of the 1999 Morgan Stanley annual report below. You can navigate through the pages in the report by either clicking on the pages listed below, or by using the keyword search tool below to find specific information within the annual report.-
 1
1 -
 2
2 -
 3
3 -
 4
4 -
 5
5 -
 6
6 -
 7
7 -
 8
8 -
 9
9 -
 10
10 -
 11
11 -
 12
12 -
 13
13 -
 14
14 -
 15
15 -
 16
16 -
 17
17 -
18
-
19
-
20
-
21
-
22
-
23
-
24
-
25
-
26
-
27
-
28
-
29
-
30
-
31
-
32
-
33
-
34
-
35
-
36
-
37
-
38
-
39
-
40
-
41
-
42
-
43
-
44
-
45
-
46
-
47
-
48
-
49
-
50
-
51
-
52
-
53
-
54
-
55
-
56
-
57
-
58
-
59
-
60
-
61
-
62
-
63
-
64
-
65
-
66
-
67
-
68
-
69
-
70
-
71
-
72
-
73
-
74
-
75
-
76
-
77
-
78
-
79
-
80
-
81
-
82
-
83
-
84
-
85
-
86
-
87
-
88
-
89
-
90
-
91
-
92
-
93
-
94
-
95
-
96
-
97
 |
 |

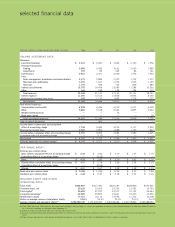
fiscal year (1) (dollars in millions, except share and per share data) 1999 1998 1997 1996 1995
INCOME STATEMENT DATA:
Revenues:
Investment banking $ 4,523 $ 3,340 $ 2,694 $ 2,190 $ 1,556
Principal transactions:
Trading 5,983 3,283 3,191 2,659 1,685
Investments 725 89 463 86 121
Commissions 2,921 2,321 2,066 1,776 1,533
Fees:
Asset management, distribution and administration 3,170 2,889 2,525 1,732 1,377
Merchant and cardmember 1,492 1,647 1,704 1,505 1,135
Servicing 1,194 928 762 809 680
Interest and dividends 13,755 16,436 13,583 11,288 10,530
Other 165 198 144 126 115
Total revenues 33,928 31,131 27,132 22,171 18,732
Interest expense 11,390 13,514 10,806 8,934 8,190
Provision for consumer loan losses 529 1,173 1,493 1,214 722
Net revenues 22,009 16,444 14,833 12,023 9,820
Non-interest expenses:
Compensation and benefits 8,398 6,636 6,019 5,071 4,005
Other 5,883 5,108 4,466 3,835 3,464
Merger-related expenses — —74——
Relocation charge — ———59
Total non-interest expenses 14,281 11,744 10,559 8,906 7,528
Gain on sale of businesses — 685———
Income before income taxes and cumulative
effect of accounting change 7,728 5,385 4,274 3,117 2,292
Provision for income taxes 2,937 1,992 1,688 1,137 827
Income before cumulative effect of accounting change 4,791 3,393 2,586 1,980 1,465
Cumulative effect of accounting change — (117) — — —
Net income $ 4,791 $ 3,276 $ 2,586 $ 1,980 $ 1,465
Earnings applicable to common shares(2) $ 4,747 $ 3,221 $ 2,520 $ 1,914 $ 1,400
PER SHARE DATA(3):
Earnings per common share:
Basic before cumulative effect of accounting change $ 4.33 $ 2.90 $ 2.19 $ 1.67 $ 1.19
Cumulative effect of accounting change — (0.10) — — —
Basic $ 4.33 $ 2.80 $ 2.19 $ 1.67 $ 1.19
Diluted before cumulative effect of accounting change $ 4.10 $ 2.76 $ 2.08 $ 1.58 $ 1.13
Cumulative effect of accounting change — (0.09) — — —
Diluted $ 4.10 $ 2.67 $ 2.08 $ 1.58 $ 1.13
Book value per common share $ 14.85 $ 11.94 $ 11.06 $ 9.22 $ 7.82
Dividends per common share $ 0.48 $ 0.40 $ 0.28 $ 0.22 $ 0.16
BALANCE SHEET AND OTHER
OPERATING DATA:
Total assets $366,967 $317,590 $302,287 $238,860 $181,961
Consumer loans, net 20,229 15,209 20,033 21,262 19,733
Total capital(4) 39,699 37,922 33,577 31,152 24,644
Long-term borrowings(4) 22,685 23,803 19,621 19,450 14,636
Shareholders’ equity 17,014 14,119 13,956 11,702 10,008
Return on average common shareholders’ equity 32.6% 24.5% 22.0% 20.0% 16.4%
Average common and equivalent shares(2)(3) 1,096,789,720 1,151,645,450 1,149,636,466 1,146,713,860 1,180,288,434
(1) Fiscal 1995 and fiscal 1996 represent the combination of Morgan Stanley Group Inc.’s financial statements for the fiscal years ended November 30 with Dean Witter, Discover &
Co.’s financial statements for the years ended December 31.
(2) Amounts shown are used to calculate basic earnings per common share.
(3) Amounts have been retroactively adjusted to give effect for a two-for-one common stock split, effected in the form of a 100% stock dividend, which became effective on January 26,
2000.
(4) These amounts exclude the current portion of long-term borrowings and include Capital Units and Preferred Securities Issued by Subsidiaries.
selected financial data