Mercury Insurance 2015 Annual Report Download - page 17
Download and view the complete annual report
Please find page 17 of the 2015 Mercury Insurance annual report below. You can navigate through the pages in the report by either clicking on the pages listed below, or by using the keyword search tool below to find specific information within the annual report.-
 1
1 -
2
-
3
-
4
-
5
-
6
-
 7
7 -
 8
8 -
 9
9 -
 10
10 -
 11
11 -
 12
12 -
 13
13 -
 14
14 -
 15
15 -
 16
16 -
 17
17 -
 18
18 -
 19
19 -
 20
20 -
 21
21 -
 22
22 -
 23
23 -
 24
24 -
 25
25 -
 26
26 -
 27
27 -
28
-
29
-
30
-
31
-
32
-
33
-
34
-
35
-
36
-
37
-
38
-
39
-
40
-
41
-
42
-
43
-
44
-
45
-
46
-
47
-
48
-
49
-
50
-
51
-
52
-
53
-
54
-
55
-
56
-
57
-
58
-
59
-
60
-
61
-
62
-
63
-
64
-
65
-
66
-
67
-
68
-
69
-
70
-
71
-
72
-
73
-
74
-
75
-
76
-
77
-
78
-
79
-
80
-
81
-
82
-
83
-
84
-
85
-
86
-
87
-
88
-
89
-
90
-
91
-
92
-
93
-
94
-
95
-
96
-
97
-
98
-
99
-
100
-
101
-
102
-
103
-
104
-
105
-
106
-
107
-
108
-
109
-
110
-
111
-
112
-
113
-
114
-
115
-
116
-
117
-
118
-
119
-
120
-
121
-
122
 |
 |
5
The increase in the provision for insured events of prior years in 2015 of approximately $12.7 million primarily resulted from
the California homeowners and automobile lines of business outside of California, which was partially offset by favorable development
in the California automobile line of business.
The decrease in the provision for insured events of prior years in 2014 of approximately $3.2 million primarily resulted from
lower than expected loss severity on California personal automobile lines of insurance business partially offset by adverse development
in other states.
The increase in the provision for insured events of prior years in 2013 of approximately $3.0 million primarily resulted from
Florida claims that were re-opened from prior years due to a state supreme court ruling that was adverse to the insurance industry.
The Company experienced estimated pre-tax catastrophe losses and loss adjustment expenses from severe weather events of
$19 million, $11 million, and $17 million in 2015, 2014, and 2013, respectively. The losses in 2015 were primarily the result of severe
storms outside of California, and rainstorm and wildfire losses in California. The losses in 2014 were primarily related to winter
freeze events on the East Coast and severe rainstorms in California. The losses in 2013 were primarily due to tornadoes in Oklahoma
and severe storms in the Midwest and the Southeast regions during the second quarter.
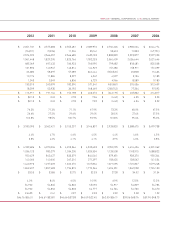
The following table presents the development of loss reserves for the period 2005 through 2015. The top section of the table
shows the reserves at the balance sheet date, net of reinsurance recoverable, for each of the indicated years. This amount represents
the estimated net losses and loss adjustment expenses for claims arising from the current and all prior years that are unpaid at the
balance sheet date, including an estimate for loss reserves that had been incurred but not reported ("IBNR") to the Company. The
second section shows the cumulative amounts paid as of successive years with respect to that reserve liability. The third section shows
the re-estimated amount of the previously recorded reserves based on experience as of the end of each succeeding year, including
cumulative payments made since the end of the respective year. Estimates change as more information develops about the frequency
and severity of claims for individual years. The bottom line shows favorable (unfavorable) development that exists when the original
reserve estimates are greater (less) than the re-estimated reserves at December 31, 2015.
In evaluating the cumulative development information in the table, it should be noted that each amount includes the effects of
all changes in development amounts for prior periods. This table does not present accident or policy year development data. Conditions
and trends that have affected development of the liability in the past may not necessarily occur in the future. Accordingly, it may not
be appropriate to extrapolate future favorable or unfavorable development based on this table.