Mercury Insurance 2015 Annual Report Download - page 16
Download and view the complete annual report
Please find page 16 of the 2015 Mercury Insurance annual report below. You can navigate through the pages in the report by either clicking on the pages listed below, or by using the keyword search tool below to find specific information within the annual report.-
 1
1 -
2
-
3
-
4
-
5
-
 6
6 -
 7
7 -
 8
8 -
 9
9 -
 10
10 -
 11
11 -
 12
12 -
 13
13 -
 14
14 -
 15
15 -
 16
16 -
 17
17 -
 18
18 -
 19
19 -
 20
20 -
 21
21 -
 22
22 -
 23
23 -
 24
24 -
 25
25 -
 26
26 -
27
-
28
-
29
-
30
-
31
-
32
-
33
-
34
-
35
-
36
-
37
-
38
-
39
-
40
-
41
-
42
-
43
-
44
-
45
-
46
-
47
-
48
-
49
-
50
-
51
-
52
-
53
-
54
-
55
-
56
-
57
-
58
-
59
-
60
-
61
-
62
-
63
-
64
-
65
-
66
-
67
-
68
-
69
-
70
-
71
-
72
-
73
-
74
-
75
-
76
-
77
-
78
-
79
-
80
-
81
-
82
-
83
-
84
-
85
-
86
-
87
-
88
-
89
-
90
-
91
-
92
-
93
-
94
-
95
-
96
-
97
-
98
-
99
-
100
-
101
-
102
-
103
-
104
-
105
-
106
-
107
-
108
-
109
-
110
-
111
-
112
-
113
-
114
-
115
-
116
-
117
-
118
-
119
-
120
-
121
-
122
 |
 |

4
advertising campaign resulting in net advertising expenditures of $44 million for the year. In 2016, the Company expects to spend
up to $42 million on advertising.
Underwriting
The Company sets its own automobile insurance premium rates, subject to rating regulations issued by the Department of
Insurance or similar governmental agency of each state in which it is licensed to operate ("DOI"). Each state has different rate
approval requirements. See "Regulation—Department of Insurance Oversight."
The Company offers standard, non-standard, and preferred private passenger automobile insurance in 13 states. The
Company also offers homeowners insurance in 12 states, commercial automobile insurance in 10 states, and mechanical breakdown
insurance in most states.
In California, "good drivers," as defined by the California Insurance Code, accounted for approximately 82% of all California
voluntary private passenger automobile policies-in-force at December 31, 2015, while higher risk categories accounted for
approximately 18%. The private passenger automobile renewal rate in California (the rate of acceptance of offers to renew) averages
approximately 95%.
Claims
The Company conducts the majority of claims processing without the assistance of outside adjusters. The claims staff
administers all claims and manages all legal and adjustment aspects of claims processing.
Losses and Loss Adjustment Expense Reserves ("Loss Reserves") and Reserve Development
The Company maintains loss reserves for both reported and unreported claims. Loss reserves for reported claims are estimated
based upon a case-by-case evaluation of the type of claim involved and the expected development of such claims. Loss reserves for
unreported claims are determined on the basis of historical information by line of insurance business. Inflation is reflected in the
reserving process through analysis of cost trends and review of historical reserve settlement.
The Company’s ultimate liability may be greater or less than management estimates of reported loss reserves. The Company
does not discount to a present value that portion of loss reserves expected to be paid in future periods. However, the Company is
required to discount loss reserves for federal income tax purposes.
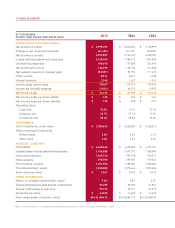
The following table provides a reconciliation of beginning and ending estimated reserve balances for the years indicated:
RECONCILIATION OF NET RESERVES FOR LOSSES AND LOSS ADJUSTMENT EXPENSES
Year Ended December 31,
2015 2014 2013
(Amounts in thousands)
Gross reserves at January 1 $ 1,091,797 $ 1,038,984 $ 1,036,123
Less reinsurance recoverable (14,484)(13,927)(12,155)
Net reserves at January 1 1,077,313 1,025,057 1,023,968
Acquisition of WAIC reserves 18,676 — —
Incurred losses and loss adjustment expenses related to:
Current year 2,132,837 1,989,315 1,959,730
Prior years 12,658 (3,193) 2,960
Total incurred losses and loss adjustment expenses 2,145,495 1,986,122 1,962,690
Loss and loss adjustment expense payments related to:
Current year 1,455,245 1,347,967 1,354,074
Prior years 654,097 585,899 607,527
Total payments 2,109,342 1,933,866 1,961,601
Net reserves at December 31 1,132,142 1,077,313 1,025,057
Reinsurance recoverable 14,546 14,484 13,927
Gross reserves at December 31 $ 1,146,688 $ 1,091,797 $ 1,038,984