Mercury Insurance 2015 Annual Report Download - page 13
Download and view the complete annual report
Please find page 13 of the 2015 Mercury Insurance annual report below. You can navigate through the pages in the report by either clicking on the pages listed below, or by using the keyword search tool below to find specific information within the annual report.-
 1
1 -
2
-
 3
3 -
 4
4 -
 5
5 -
 6
6 -
 7
7 -
 8
8 -
 9
9 -
 10
10 -
 11
11 -
 12
12 -
 13
13 -
 14
14 -
 15
15 -
 16
16 -
 17
17 -
 18
18 -
 19
19 -
 20
20 -
 21
21 -
 22
22 -
 23
23 -
24
-
25
-
26
-
27
-
28
-
29
-
30
-
31
-
32
-
33
-
34
-
35
-
36
-
37
-
38
-
39
-
40
-
41
-
42
-
43
-
44
-
45
-
46
-
47
-
48
-
49
-
50
-
51
-
52
-
53
-
54
-
55
-
56
-
57
-
58
-
59
-
60
-
61
-
62
-
63
-
64
-
65
-
66
-
67
-
68
-
69
-
70
-
71
-
72
-
73
-
74
-
75
-
76
-
77
-
78
-
79
-
80
-
81
-
82
-
83
-
84
-
85
-
86
-
87
-
88
-
89
-
90
-
91
-
92
-
93
-
94
-
95
-
96
-
97
-
98
-
99
-
100
-
101
-
102
-
103
-
104
-
105
-
106
-
107
-
108
-
109
-
110
-
111
-
112
-
113
-
114
-
115
-
116
-
117
-
118
-
119
-
120
-
121
-
122
 |
 |

1
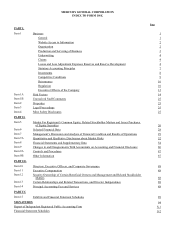
PART I
Item 1. Business
General
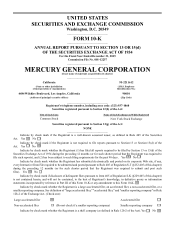
Mercury General Corporation ("Mercury General") and its subsidiaries (referred to herein collectively as the "Company")
are primarily engaged in writing personal automobile insurance through 14 insurance subsidiaries (referred to herein collectively
as the "Insurance Companies") in 13 states, principally California. The Company also writes homeowners, commercial automobile,
commercial property, mechanical breakdown, and umbrella insurance.
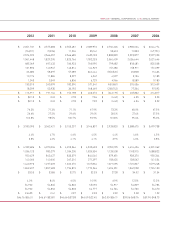
The direct premiums written for the years ended December 31, 2015, 2014, and 2013 by state and line of insurance business
were:
Year Ended December 31, 2015
(Dollars in thousands)
Private
Passenger
Automobile Homeowners
Commercial
Automobile Other Lines Total
California $ 1,946,922 $ 333,397 $ 78,735 $ 96,791 $ 2,455,845 81.5%
Florida (1) 153,206 9 27,281 738 181,234 6.0%
Other states (2) 245,645 68,843 47,495 13,834 375,817 12.5%
Total $ 2,345,773 $ 402,249 $ 153,511 $ 111,363 $ 3,012,896 100.0%
77.9% 13.3% 5.1% 3.7% 100.0%
Year Ended December 31, 2014
(Dollars in thousands)
Private
Passenger
Automobile Homeowners
Commercial
Automobile Other Lines Total
California $ 1,852,291 $ 302,493 $ 69,129 $ 84,374 $ 2,308,287 80.9%
Florida (1) 131,281 7 26,234 4,676 162,198 5.7%
Other states (2) 239,501 71,936 40,565 30,682 382,684 13.4%
Total $ 2,223,073 $ 374,436 $ 135,928 $ 119,732 $ 2,853,169 100.0%
77.9% 13.1% 4.8% 4.2% 100.0%
Year Ended December 31, 2013
(Dollars in thousands)
Private
Passenger
Automobile Homeowners
Commercial
Automobile Other Lines Total
California $ 1,760,352 $ 267,563 $ 53,488 $ 72,617 $ 2,154,020 78.7%
Florida (1) 133,947 — 22,331 7,433 163,711 6.0%
Other states (2) 271,258 72,450 28,870 47,163 419,741 15.3%
Total $ 2,165,557 $ 340,013 $ 104,689 $ 127,213 $ 2,737,472 100.0%
79.1% 12.4% 3.8% 4.7% 100.0%
_____________
(1) The Company is writing and expects to continue writing nominal premiums in the Florida homeowners market.
(2) No individual state accounts for more than 4% of total direct premiums written.
The Company offers the following types of automobile coverage: collision, property damage, bodily injury ("BI"),
comprehensive, personal injury protection ("PIP"), underinsured and uninsured motorist, and other hazards.