LG 2008 Annual Report Download - page 37
Download and view the complete annual report
Please find page 37 of the 2008 LG annual report below. You can navigate through the pages in the report by either clicking on the pages listed below, or by using the keyword search tool below to find specific information within the annual report.-
 1
1 -
2
-
3
-
4
-
5
-
6
-
7
-
8
-
9
-
10
-
11
-
12
-
13
-
14
-
15
-
16
-
17
-
18
-
19
-
20
-
21
-
22
-
23
-
24
-
25
-
26
-
 27
27 -
 28
28 -
 29
29 -
 30
30 -
 31
31 -
 32
32 -
 33
33 -
 34
34 -
 35
35 -
 36
36 -
 37
37 -
 38
38 -
 39
39 -
 40
40 -
 41
41 -
 42
42 -
 43
43 -
 44
44 -
 45
45 -
 46
46 -
 47
47
 |
 |

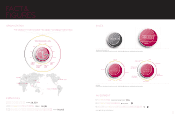
ORGANIZATION SALES
IN BILLI
O
N
SO
F K
O
REAN W
O
N
G
lobal revenue, referring to the total revenue of the global subsidiaries’ account excluding internal tra n sa ction
s
AS O
F 2
008
G
lobal revenue, referring to the total revenue of the global subsidiaries’ account excluding internal tra n sa ction
s
INVESTMENT
A
S OF 2008
/
IN BILLIONS OF KOREAN WON
E
Q
UIPM ENT INVESTM EN T
9
55
R
&
D INVE
S
TM EN T 1,774
T
O
TAL2,72
9
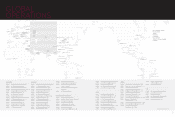
40,848 49,333
O
REA 1
3%
NO
RTH
A
MERICA
3
0
%
EUROPE 18
%
MIDDLE EA
ST
& AFRICA 8
%
C
HINA
&
A
S
IA
PACIFIC 16
%
SOUTH & CENTRAL
SOU
AM ERICA 10%
MERIC
C
IS
5%
SALES
BY REGION
FACT &
FIGURES
T
O
TA
L
84,44
5
EMPLOYEES
K
O
REA 28,659
O
VER
S
EA
S
55,786
7071
SALES
BY COMPANY
MC 32%
Hom e Entertainm entMobile Com m unicationsHom e ApplianceAir ConditioningBusiness Solutions
CTO CSO
Corporate
Support
Division
CHO
CFO CM O
CGTM O
Corporate
Audit
Team
Corporate
Design
Center
CSCO
Productivity
Research
Institute
CPO
VICE CHAIRM AN & CEO
AC 9% B S 9%
HE 33%
HA 17%
Europe
China
Korea
North Am erica
South & Central Am erica
Asia
CIS
Middle East & Africa