Kimberly-Clark 2015 Annual Report Download - page 18
Download and view the complete annual report
Please find page 18 of the 2015 Kimberly-Clark annual report below. You can navigate through the pages in the report by either clicking on the pages listed below, or by using the keyword search tool below to find specific information within the annual report.-
 1
1 -
2
-
3
-
4
-
5
-
6
-
7
-
 8
8 -
 9
9 -
 10
10 -
 11
11 -
 12
12 -
 13
13 -
 14
14 -
 15
15 -
 16
16 -
 17
17 -
 18
18 -
 19
19 -
 20
20 -
 21
21 -
 22
22 -
 23
23 -
 24
24 -
 25
25 -
 26
26 -
 27
27 -
 28
28 -
29
-
30
-
31
-
32
-
33
-
34
-
35
-
36
-
37
-
38
-
39
-
40
-
41
-
42
-
43
-
44
-
45
-
46
-
47
-
48
-
49
-
50
-
51
-
52
-
53
-
54
-
55
-
56
-
57
-
58
-
59
-
60
-
61
-
62
-
63
-
64
-
65
-
66
-
67
-
68
-
69
-
70
-
71
-
72
-
73
-
74
-
75
-
76
-
77
-
78
-
79
-
80
-
81
-
82
-
83
-
84
-
85
-
86
-
87
-
88
-
89
-
90
-
91
-
92
-
93
-
94
-
95
-
96
 |
 |

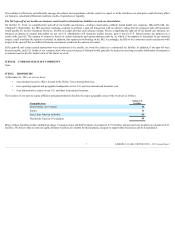
Consolidated Net Sales and Adjusted Operating Profit
Percent Change
2015vs.2014
Net sales of $18.6 billion decreased 6 percent compared to 2014, as changes in foreign currency
exchangeratesreducednetsalesmorethan10percent.Organicnetsalesincreased5percent,asvolumes
increased4percentandproductmixwasfavorableby1percent.Adjustedoperatingprofitof$3,210in
2015 increased 1 percent compared to $3,184 in 2014. The comparisons benefited from organic sales
growth, FORCE cost savingsof $365, input costdeflation of $150 and $65of savings from the 2014
Organization Restructuring. Translation effects due to changes in foreign currency exchange rates
lowered adjusted operating profit by $360 and foreign currency transaction effects also negatively
impactedtheoperatingprofitcomparisons.Totalmarketing,researchandgeneralexpensesincreasedon
alocalcurrencybasis,drivenbyhigheradministrativecosts.
2014vs.2013
Netsalesof$19.7billionincreased1percentcomparedto2013.Organicnetsalesincreased4percent,
withvolumesandnetsellingpriceseachincreasingnetsales by2percent.Foreigncurrencyexchange
rateswereunfavorableby2percentandlowersalesinconjunctionwithEuropeanstrategicchangesand
pulpandtissuerestructuringactionsreducedsalesby1percent.Adjustedoperatingprofitof$3,184in
2014 increased 5 percent compared to $3,020 in 2013. The comparisons benefited from organic sales
growth, FORCE cost savings of $320 and $30 of savings from pulp and tissue restructuring actions.
Inputcostswere$240higheroverallversus2013.Foreigncurrencytranslationeffectsreducedoperating
profitby$75andcurrencytransactioneffectsalsonegativelyimpactedtheoperatingprofitcomparison.
Net Sales
2015 vs.
2014
2014 vs.
2013
Volume
4
2
Restructuring
—
(1)
NetPrice
—
2
Mix/Other(a)
—
—
Currency
(10)
(2)
Total
(5.7)
0.8
Adjusted Operating Profit
Volume
8
5
NetPrice
1
13
InputCosts
5
(8)
CostSavings
11
11
CurrencyTranslation
(11)
(3)
Other
(13)
(13)
Total
0.8
5.4
(a)Mix/Otherincludesrounding
Other (Income) & Expense, Net Reconciliation of GAAP to Non-GAAP
Other(income)&expense,netincludesthefollowingadjustingitems:
Year Ended December 31
2015
2014
2013
Other(income)andexpense,net,GAAP $ 1,568
$ 453
$ 7
Lessadjustmentsfor:
PensionSettlements 1,358
—
—
ChargesRelatedtoVenezuelanOperations 148
421
36
RegulatoryDisputeinMiddleEast —
35
—
EuropeanStrategicChanges —
—
5
Adjustedother(income)andexpense,net $ 62
$(3)
$ (34)
Adjustedother(income)andexpense,netwasexpenseof$62in2015andincomeof$3in2014.Thechangewasdrivenbyhigherforeigncurrencytransaction
lossesin2015comparedto2014,andgainsonassetsalesin2014.Lowerincomeof$3in2014comparedto$34in2013wasdrivenbyhigherforeigncurrency
transactionlossesin2014,asbothperiodsincludedgainsonthesaleofnon-coreassets.
15 KIMBERLY-CLARKCORPORATION - 2015 Annual Report