Kia 2000 Annual Report Download - page 2
Download and view the complete annual report
Please find page 2 of the 2000 Kia annual report below. You can navigate through the pages in the report by either clicking on the pages listed below, or by using the keyword search tool below to find specific information within the annual report.-
 1
1 -
 2
2 -
 3
3 -
 4
4 -
 5
5 -
 6
6 -
 7
7 -
 8
8 -
 9
9 -
 10
10 -
 11
11 -
 12
12 -
 13
13 -
14
-
15
-
16
-
17
-
18
 |
 |
표
KiaM otors annual report s 2000
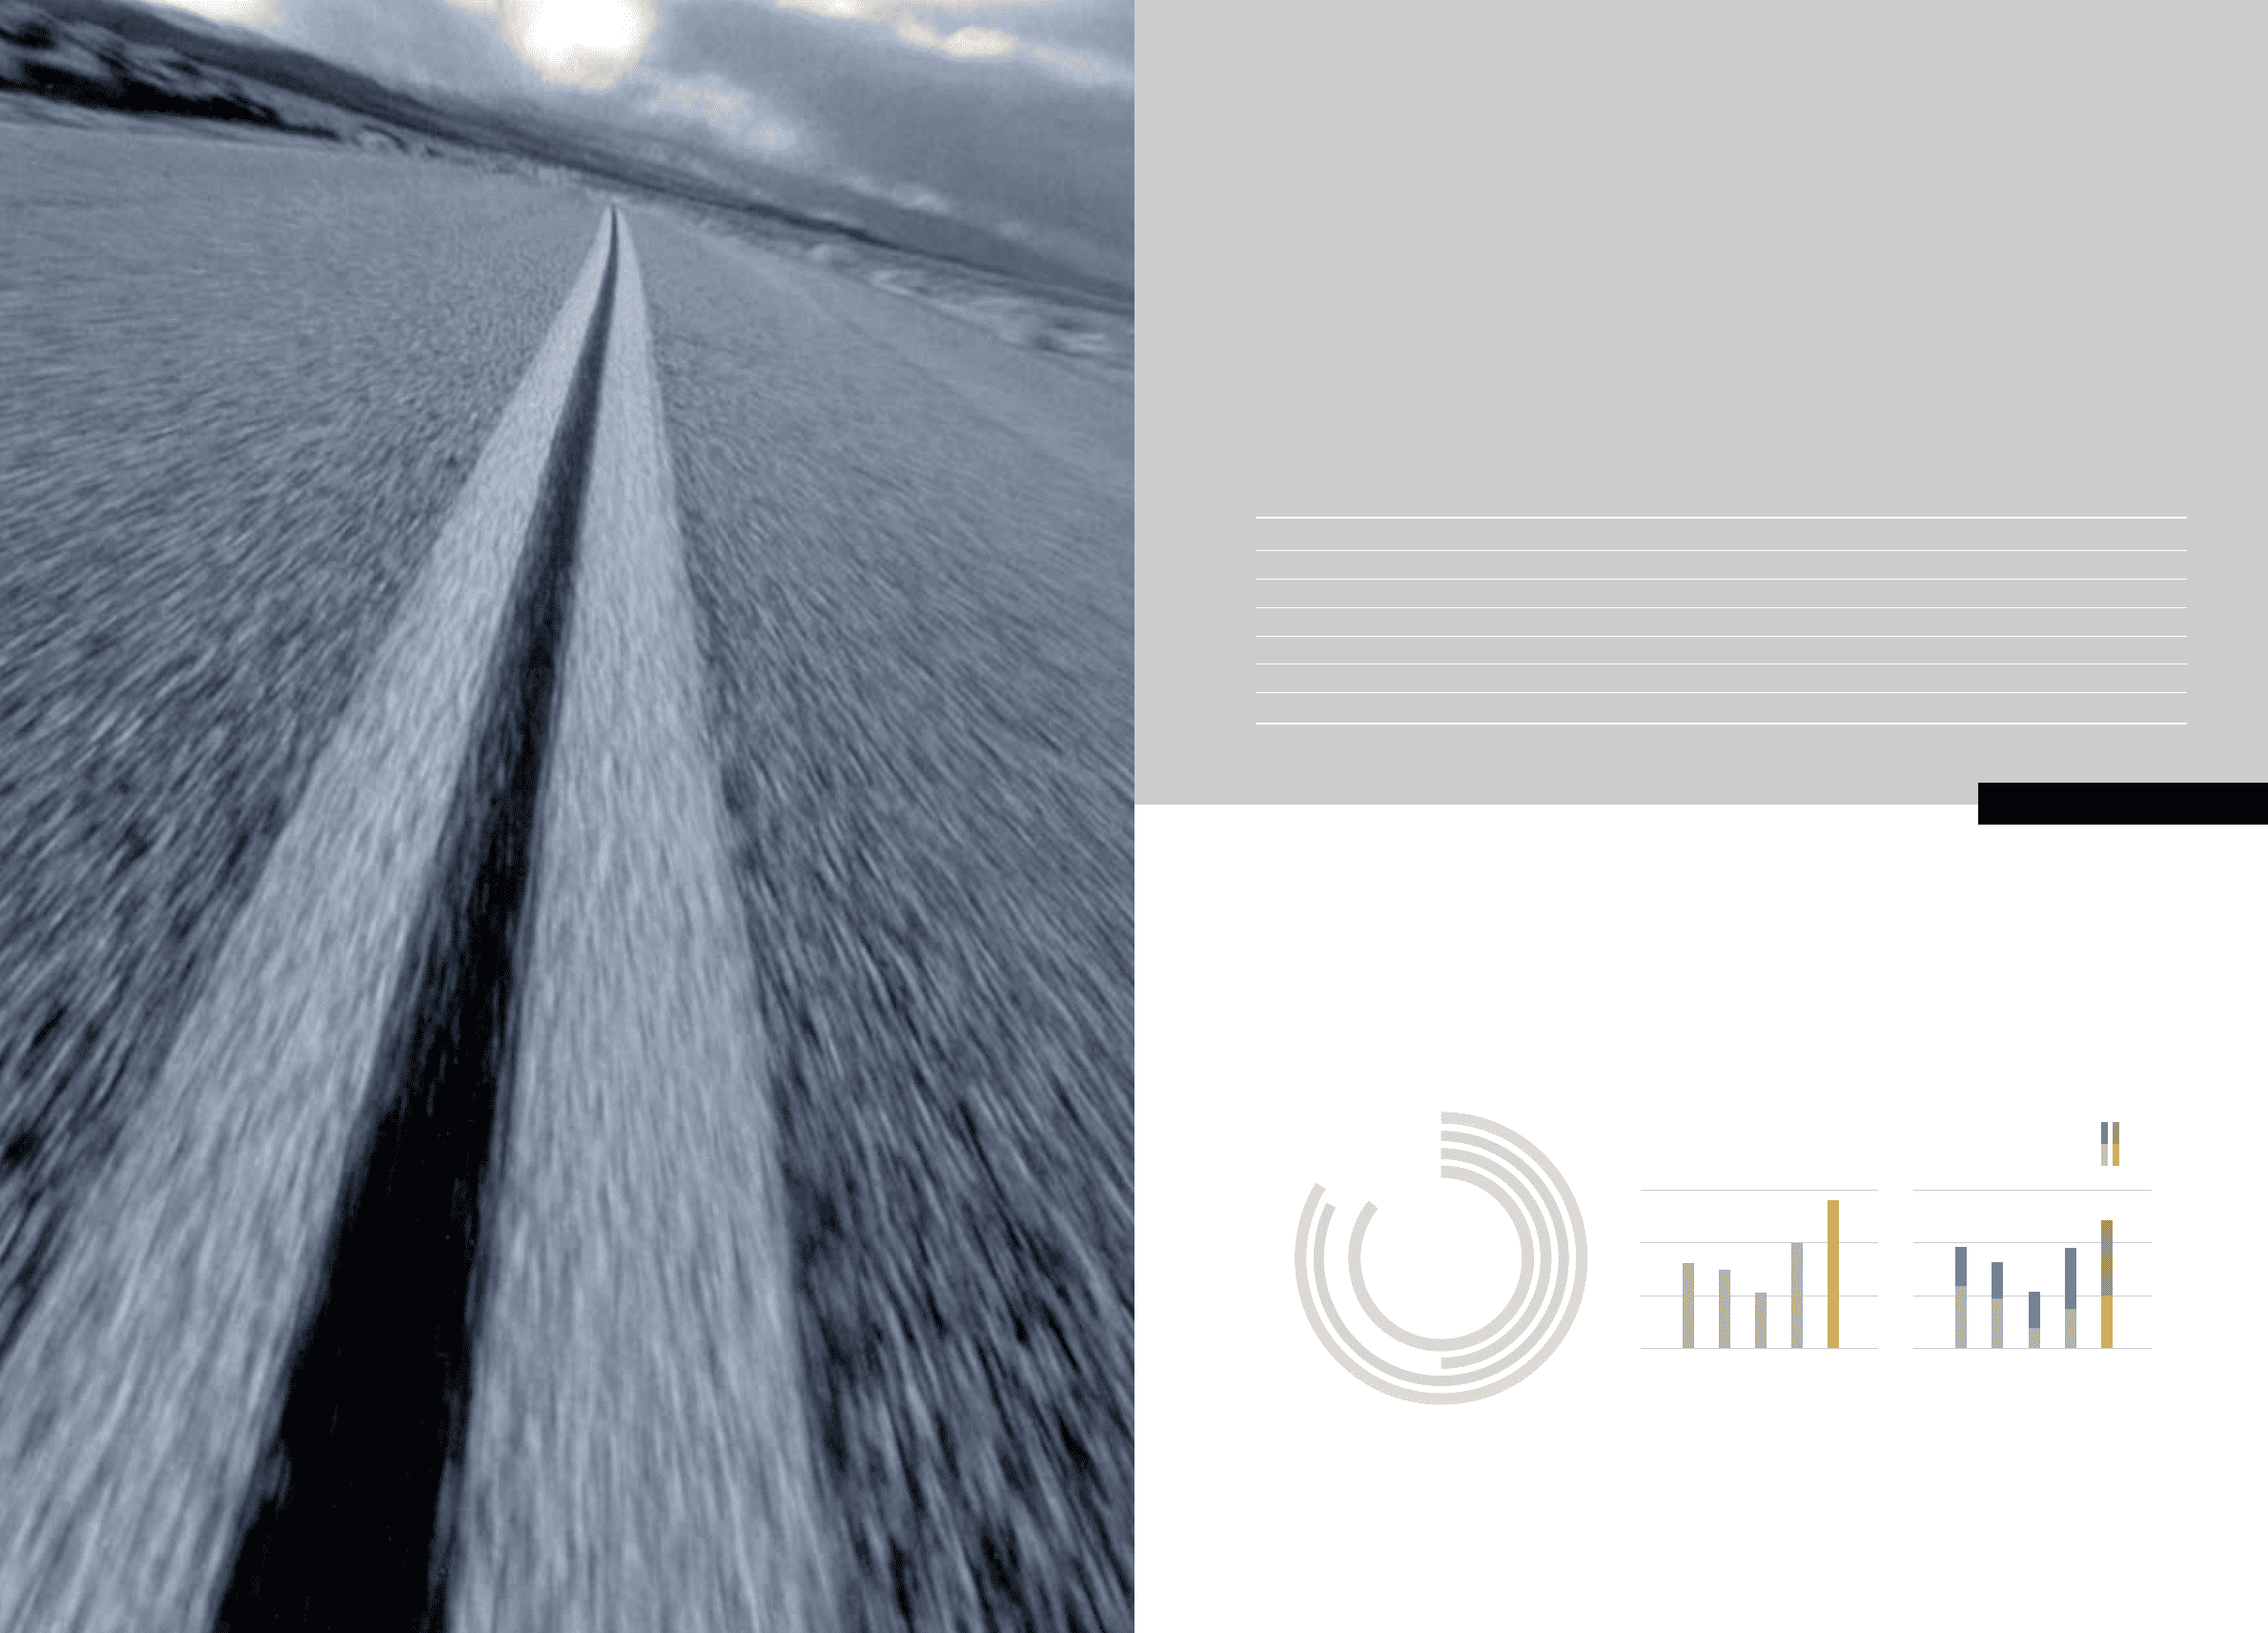
In 2000, Kia Motors recorded over 10.8 trillion won in sales, the highest in our history, while also realizing 330 billion won in net
income. This means that weve been in the black for two consecutive years. In spite of difficult economic conditions around the
world, Kia sold 410,300 automobiles on the domestic market for a 36% year-on-year increase. Overseas, we recorded a 17%
increase with 549,437 units sold. These outstanding results were based on Kias aggressive management and ceaseless
innovation in the areas of quality and technology.
At Kia, our new vision is based on the successes of 2000, both at home and abroad.
Financial Statement
KiaM otors annual report s 2000
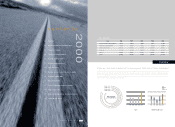
Key statistics
KiaM otors annual report s 2000
contents
Overview
Overcoming obstacles and starting anew
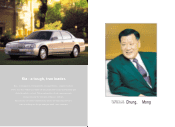
Presidents message
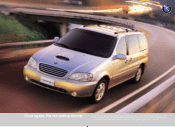
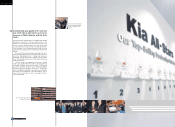
Rebirth as a strong competitor
Domestic business activities
Overseas business activities
After-sales service
Building customer trust with world-class quality
Production, quality, R&D
Main developments
Report of independent public accountants
Financial statements
History / Challenging the worlds best automakers
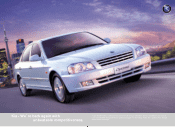
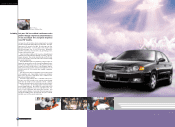
The Kia M otorslineup
02
03
07
09
11
13
15
17
19
21
25
27
31
33
2000 81,693
1999 76,813
1998 49,932
1997 89,529
1996 1997 1998 1999 2000 1996 1997 1998 1999 2000
Export
Domestic
Sales Number of units sold
2000
Overview
Area
Total assets
(unit:one hundred million won)
Sales
(unit:one hundred million won)
Number of units sold
Domestic
Export
( KD )
69,447
66,071
770,147
447,213
322,934
(69,942)
1996
89,529
63,815
692,606
353,764
338,842
(61,490)
1997
49,932
45,107
438,118
130,913
307,205
(71,560)
1998
76,813
79,306
769,641
300,998
468,643
(89,690)
1999
81,693
108,060
959,737
410,300
549,437
(101,770)
2000
Key statistics
Total assets
(unit: one hundred million won)