Kenwood 2003 Annual Report Download - page 19
Download and view the complete annual report
Please find page 19 of the 2003 Kenwood annual report below. You can navigate through the pages in the report by either clicking on the pages listed below, or by using the keyword search tool below to find specific information within the annual report.-
 1
1 -
2
-
3
-
4
-
5
-
6
-
7
-
8
-
 9
9 -
 10
10 -
 11
11 -
 12
12 -
 13
13 -
 14
14 -
 15
15 -
 16
16 -
 17
17 -
 18
18 -
 19
19 -
 20
20 -
 21
21 -
 22
22 -
 23
23 -
 24
24 -
 25
25 -
 26
26 -
 27
27 -
 28
28 -
 29
29 -
30
-
31
-
32
-
33
-
34
-
35
-
36
-
37
-
38
-
39
-
40
 |
 |

17
KENWOOD Corporation Annual Report 2003
business restructuring, which were offset in the previous fiscal
year.
Long-term liabilities shrank 35.8% to 19.6 billion yen, as
corporate bonds and long-term borrowings decreased,
although reserves for employees' retirement allowances were
added.
Cash flows
The outstanding balance of cash and cash equivalents stood at
27.1 billion yen at the end of March 2003, up 5.4 billion yen
from the previous fiscal year. Cash flows from operating
activities dropped 4.8 billion yen to an income of 10.4 billion
yen; trade notes and accounts receivable, as well as inventories
declined 21.4 billion yen and 9 billion yen, respectively, but
trade notes and accounts payable also fell 31.1 billion yen.
Cash flow from investing activities was net expenditure of 5.9
billion yen, 2.1 billion yen less than the previous fiscal year, due
to decreased spending on the payment for the purchase of
tangible fixed assets and software. Cash flows from financing
activities marked an income of 1 billion yen, thanks to proceeds
worth 2 billion yen from the issuance of shares and decreased
spending on the repayment of long-term debt.
Capital expenditure
Total capital expenditure for the fiscal year ended March 2003
decreased 45.8% from the preceding fiscal year to 6.7 billion
yen, which was spent mainly on molds and dies for new
products, equipment replacements, and development of
software installed in products.
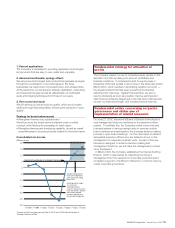
Financial indicators
The deficit in working capital at the end of the fiscal year ended
March 2003 was 5.1 billion yen. The current ratio was 95.3%
(78.3% for the previous fiscal year). The shareholders' equity
ratio was 9.6% (negative 9.3% for the previous fiscal year) and
the capital turnover rate was 1.59 (1.65 for the previous fiscal
year).
Total Shareholders' Equity Total Assets Equity Ratio
(20) (10) 30
2003
2002
2001
2000
1999
01020
(Billions of yen)
0100 15050 200
2003
2002
2001
2000
1999
(Billions of yen)
2003
2002
2001
2000
1999
(10) 20
100
(%)