Kenwood 2003 Annual Report Download - page 14
Download and view the complete annual report
Please find page 14 of the 2003 Kenwood annual report below. You can navigate through the pages in the report by either clicking on the pages listed below, or by using the keyword search tool below to find specific information within the annual report.-
 1
1 -
2
-
3
-
 4
4 -
 5
5 -
 6
6 -
 7
7 -
 8
8 -
 9
9 -
 10
10 -
 11
11 -
 12
12 -
 13
13 -
 14
14 -
 15
15 -
 16
16 -
 17
17 -
 18
18 -
 19
19 -
 20
20 -
 21
21 -
 22
22 -
 23
23 -
 24
24 -
25
-
26
-
27
-
28
-
29
-
30
-
31
-
32
-
33
-
34
-
35
-
36
-
37
-
38
-
39
-
40
 |
 |

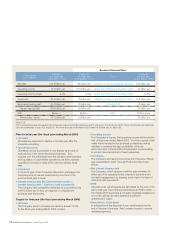
Cash flows from operating activities
Cash flows from investing activities
Cash flows from financing activities
Effect of exchange rate fluctuations on cash and cash equivalents
Net increase in cash and cash equivalents
Cash and cash equivalents at beginning of year
Cash and cash equivalents of newly consolidated subsidiaries, beginning of year
Cash and cash equivalents at end of year
15.2
△ 8
△ 6.8
0.4
0.8
20.9
0
21.7
10.4
△ 5.9
1
△ 0.2
5.2
21.7
0.2
27.1
Fiscal year ended
March 2002 Fiscal year ended
March 2003
△ 4.8
2.1
7.8
△ 0.6
4.4
0.8
0.2
5.4
Increase
(decrease)
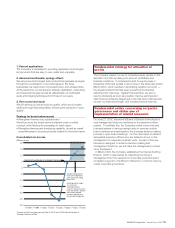
Cash flows (Billions of yen)
Cash flows
The Company reported an income of 10.4 billion yen in cash
flows from operating activities. Net income sharply improved and
inventories reduced, while payments were needed for business
restructuring implemented under the Kenwood Revitalization
Action Plan and trade notes and accounts payable were reduced.
Cash flows from investing activities were 5.9 billion yen in net
spending. Investments in intangible fixed assets declined as a
result of the phasing out of the production of cellular phones as
part of the Kenwood Revitalization Action Plan.
Cash flows from financing activities marked an income of 1
billion yen, partly because of third-party allotment of shares worth
2.1 billion yen.
12 KENWOOD Corporation Annual Report 2003