JCPenney 2013 Annual Report Download - page 23
Download and view the complete annual report
Please find page 23 of the 2013 JCPenney annual report below. You can navigate through the pages in the report by either clicking on the pages listed below, or by using the keyword search tool below to find specific information within the annual report.-
 1
1 -
2
-
3
-
4
-
5
-
6
-
7
-
8
-
9
-
10
-
11
-
12
-
 13
13 -
 14
14 -
 15
15 -
 16
16 -
 17
17 -
 18
18 -
 19
19 -
 20
20 -
 21
21 -
 22
22 -
 23
23 -
 24
24 -
 25
25 -
 26
26 -
 27
27 -
 28
28 -
 29
29 -
 30
30 -
 31
31 -
 32
32 -
 33
33 -
34
-
35
-
36
-
37
-
38
-
39
-
40
-
41
-
42
-
43
-
44
-
45
-
46
-
47
-
48
-
49
-
50
-
51
-
52
-
53
-
54
-
55
-
56
-
57
-
58
-
59
-
60
-
61
-
62
-
63
-
64
-
65
-
66
-
67
-
68
-
69
-
70
-
71
-
72
-
73
-
74
-
75
-
76
-
77
-
78
-
79
-
80
-
81
-
82
-
83
-
84
-
85
-
86
-
87
-
88
-
89
-
90
-
91
-
92
-
93
-
94
-
95
-
96
-
97
-
98
-
99
-
100
-
101
-
102
-
103
-
104
-
105
-
106
-
107
-
108
-
109
-
110
-
111
-
112
-
113
-
114
-
115
-
116
-
117
 |
 |

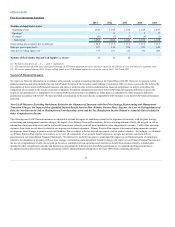
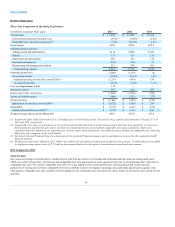
Adjusted Operating Income/(Loss).
($ in millions)
As a percent of sales
Adjusted operating income/(loss) (non-GAAP)
As a percent of sales
Adjusted Income/(Loss) and Adjusted Diluted EPS from Continuing Operations.
($ in millions, except per share data)
Adjusted income/(loss) (non-GAAP) from continuing
operations
Adjusted diluted EPS (non-GAAP) from continuing
operations
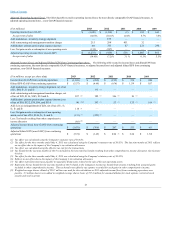
(1) Tax effect was calculated using the Company's statutory rate of 38.82%.
(2) Tax effect for the three months ended May 4, 2013 was calculated using the Company's statutory rate of 38.82%. The last nine months of 2013 reflects
no tax effect due to the impact of the Company's tax valuation allowance.
(3) Tax effect was calculated using the effective tax rate for the transactions.
(4) Tax benefit for the last nine months of 2013 is included in the line item Tax benefit resulting from other comprehensive income allocation. See footnote
8 below.
(5) Tax effect for the three months ended May 4, 2013 was calculated using the Company's statutory rate of 38.82%.
(6) Reflects no tax effect due to the impact of the Company's tax valuation allowance.
(7) Tax effect represents state taxes payable in separately filing states related to the sale of the non-operating assets.
(8) Represents the tax benefit for the last nine months of 2013 related to the Company's income tax benefit from income resulting from actuarial gains
included in other comprehensive income. This tax benefit was offset by tax expense recorded for such gains in other comprehensive income.
(9) Weighted average shares–diluted of 220.7 million was used for this calculation as 2011 adjusted income/(loss) from continuing operations was
positive. 3.3 million shares were added to weighted average shares–basic of 217.4 million for assumed dilution for stock options, restricted stock
awards and stock warrant.