JCPenney 2013 Annual Report Download - page 21
Download and view the complete annual report
Please find page 21 of the 2013 JCPenney annual report below. You can navigate through the pages in the report by either clicking on the pages listed below, or by using the keyword search tool below to find specific information within the annual report.-
 1
1 -
2
-
3
-
4
-
5
-
6
-
7
-
8
-
9
-
10
-
 11
11 -
 12
12 -
 13
13 -
 14
14 -
 15
15 -
 16
16 -
 17
17 -
 18
18 -
 19
19 -
 20
20 -
 21
21 -
 22
22 -
 23
23 -
 24
24 -
 25
25 -
 26
26 -
 27
27 -
 28
28 -
 29
29 -
 30
30 -
 31
31 -
32
-
33
-
34
-
35
-
36
-
37
-
38
-
39
-
40
-
41
-
42
-
43
-
44
-
45
-
46
-
47
-
48
-
49
-
50
-
51
-
52
-
53
-
54
-
55
-
56
-
57
-
58
-
59
-
60
-
61
-
62
-
63
-
64
-
65
-
66
-
67
-
68
-
69
-
70
-
71
-
72
-
73
-
74
-
75
-
76
-
77
-
78
-
79
-
80
-
81
-
82
-
83
-
84
-
85
-
86
-
87
-
88
-
89
-
90
-
91
-
92
-
93
-
94
-
95
-
96
-
97
-
98
-
99
-
100
-
101
-
102
-
103
-
104
-
105
-
106
-
107
-
108
-
109
-
110
-
111
-
112
-
113
-
114
-
115
-
116
-
117
 |
 |

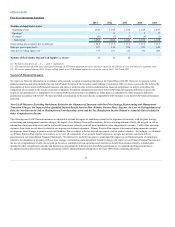
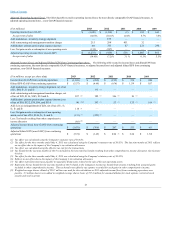
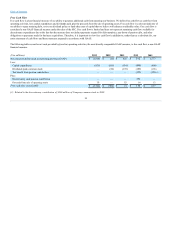
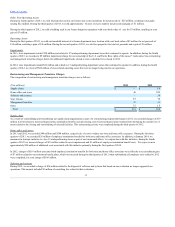
($ in millions, except per share data)
Adjusted operating income/(loss) (non-GAAP)
As a percent of sales (non-GAAP)
Adjusted income/(loss) (non-GAAP) from continuing
operations(3)
Adjusted earnings/(loss) per share from continuing
operations, diluted (non-GAAP)
Free cash flow (non-GAAP)
(1) Includes the effect of the 53rdweek in 2012. Excluding sales of $163 million for the 53rd week in 2012, total net sales decreased 7.5% and 25.7% in
2013 and 2012, respectively.
(2) Comparable store sales are presented on a 52-week basis and include sales from new and relocated stores that have been opened for 12 consecutive
full fiscal months and Internet sales. Stores closed for an extended period are not included in comparable store sales calculations, while stores
remodeled and minor expansions not requiring store closures remain in the calculations. Our definition and calculation of comparable store sales may
differ from other companies in the retail industry.
(3) See Non-GAAP Financial Measures beginning on the following page for additional information and reconciliation to the most directly comparable
GAAP financial measure.
(4) Weighted average shares–diluted of 220.7 million was used for this calculation as adjusted income/(loss) from continuing operations was positive. 3.3
million shares were added to weighted average shares–basic of 217.4 million for assumed dilution for stock options, restricted stock awards and stock
warrant.
(5) On May 15, 2012, we announced that we had discontinued the quarterly $0.20 per share dividend.