JCPenney 2013 Annual Report Download - page 101
Download and view the complete annual report
Please find page 101 of the 2013 JCPenney annual report below. You can navigate through the pages in the report by either clicking on the pages listed below, or by using the keyword search tool below to find specific information within the annual report.-
 1
1 -
2
-
3
-
4
-
5
-
6
-
7
-
8
-
9
-
10
-
11
-
12
-
13
-
14
-
15
-
16
-
17
-
18
-
19
-
20
-
21
-
22
-
23
-
24
-
25
-
26
-
27
-
28
-
29
-
30
-
31
-
32
-
33
-
34
-
35
-
36
-
37
-
38
-
39
-
40
-
41
-
42
-
43
-
44
-
45
-
46
-
47
-
48
-
49
-
50
-
51
-
52
-
53
-
54
-
55
-
56
-
57
-
58
-
59
-
60
-
61
-
62
-
63
-
64
-
65
-
66
-
67
-
68
-
69
-
70
-
71
-
72
-
73
-
74
-
75
-
76
-
77
-
78
-
79
-
80
-
81
-
82
-
83
-
84
-
85
-
86
-
87
-
88
-
89
-
90
-
 91
91 -
 92
92 -
 93
93 -
 94
94 -
 95
95 -
 96
96 -
 97
97 -
 98
98 -
 99
99 -
 100
100 -
 101
101 -
 102
102 -
 103
103 -
 104
104 -
 105
105 -
 106
106 -
 107
107 -
 108
108 -
 109
109 -
 110
110 -
 111
111 -
112
-
113
-
114
-
115
-
116
-
117
 |
 |
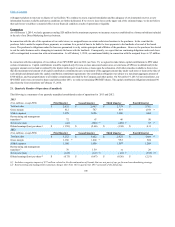
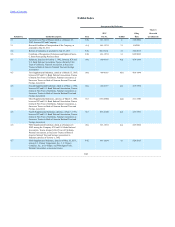
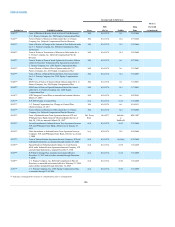
($ in million)
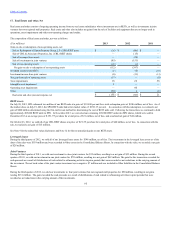
(3) The second and third quarters of 2013 contained increases to our tax valuation allowance of $218 million and $184 million, respectively and a
decrease of $178 million to our valuation allowance in the fourth quarter. The second, third and fourth quarters of 2013 contained gains from non-
operating assets sales (see Note 17) of $62 million, $24 million and $46 million, respectively. The fourth quarter of 2013 includes $12 million of store
impairments charges and a $9 million impairment to our monet trade name recorded in Real estate and other, net (see Note 17) Additionally, during
the fourth quarter of 2013 we recognized a tax benefit of $270 million from income related to actuarial gains included in other comprehensive income.
This tax benefit was offset by tax expense recorded for such gains in other comprehensive income.
(4) EPS is computed independently for each of the quarters presented. The sum of the quarters may not equal the total year amount due to the impact of
changes in average quarterly shares outstanding.
(5) Sales for the 53rd week were $163 million.
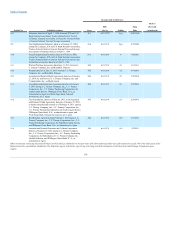
(6) The first and second quarters of 2012 include $53 million and $102 million, respectively, of markdowns related to the alignment of inventory with our
prior strategy.
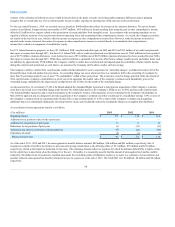
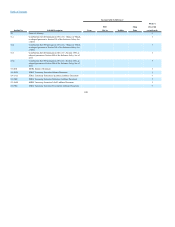
(7) Restructuring and management transition charges (See Note 16) by quarter for 2012 consisted of the following:
($ in millions)
(8) Includes a gain of $200 million related to the redemption of REIT units, net of fees, included in Real estate and other, net (see Note 17).
(9) Includes a net gain of $197 million related to the sale of non-operating assets, net of fees, included in Real estate and other, net (see Note 17).
(10)Includes $26 million of store impairments chargesand thewrite-off of $60 million of operating assets that were no longer being used in our operations
recorded in Real estate and other, net (see Note 17).