JCPenney 2013 Annual Report Download - page 109
Download and view the complete annual report
Please find page 109 of the 2013 JCPenney annual report below. You can navigate through the pages in the report by either clicking on the pages listed below, or by using the keyword search tool below to find specific information within the annual report.-
 1
1 -
2
-
3
-
4
-
5
-
6
-
7
-
8
-
9
-
10
-
11
-
12
-
13
-
14
-
15
-
16
-
17
-
18
-
19
-
20
-
21
-
22
-
23
-
24
-
25
-
26
-
27
-
28
-
29
-
30
-
31
-
32
-
33
-
34
-
35
-
36
-
37
-
38
-
39
-
40
-
41
-
42
-
43
-
44
-
45
-
46
-
47
-
48
-
49
-
50
-
51
-
52
-
53
-
54
-
55
-
56
-
57
-
58
-
59
-
60
-
61
-
62
-
63
-
64
-
65
-
66
-
67
-
68
-
69
-
70
-
71
-
72
-
73
-
74
-
75
-
76
-
77
-
78
-
79
-
80
-
81
-
82
-
83
-
84
-
85
-
86
-
87
-
88
-
89
-
90
-
91
-
92
-
93
-
94
-
95
-
96
-
97
-
98
-
 99
99 -
 100
100 -
 101
101 -
 102
102 -
 103
103 -
 104
104 -
 105
105 -
 106
106 -
 107
107 -
 108
108 -
 109
109 -
 110
110 -
 111
111 -
 112
112 -
 113
113 -
 114
114 -
 115
115 -
 116
116 -
 117
117
 |
 |

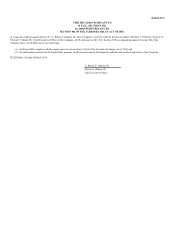
Exhibit 12
J.C. Penney Company, Inc.
Computation of Ratios of Earnings to Fixed Charges
(Unaudited)
52 Weeks
53 Weeks
52 Weeks 52 Weeks
52 Weeks
Ended
Ended
Ended Ended
Ended
($ in millions) 2/1/2014
2/2/2013
1/28/2012 1/29/2011
1/30/2010
Income/(loss) from continuing operations before income taxes $(1,886)
$(1,536)
$ (229) $ 581
$403
Fixed charges:
Net interest expense 352
226
227 231
260
Interest income included in net interest 1
6
8 11
10
Loss on extinguishment of debt, bond premiums and
unamortized costs 114
—
— 20
—
Estimated interest within rental expense 99
101
104 102
98
Capitalized interest —
—
— —
4
Total fixed charges 566
333
339 364
372
Capitalized interest —
—
— —
(4)
Total earnings available for fixed charges $(1,320)
$(1,203)
$110 $945
$ 771
Ratio of earnings to fixed charges (2.3)
(3.6)
0.3
2.6
2.1
Coverage deficiency 1,886
1,536
229
—
—