Incredimail 2014 Annual Report Download - page 8
Download and view the complete annual report
Please find page 8 of the 2014 Incredimail annual report below. You can navigate through the pages in the report by either clicking on the pages listed below, or by using the keyword search tool below to find specific information within the annual report.-
 1
1 -
 2
2 -
 3
3 -
 4
4 -
 5
5 -
 6
6 -
 7
7 -
 8
8 -
 9
9 -
 10
10 -
 11
11 -
 12
12 -
 13
13 -
 14
14 -
 15
15 -
 16
16 -
 17
17 -
 18
18 -
 19
19 -
20
-
21
-
22
-
23
-
24
-
25
-
26
-
27
-
28
-
29
-
30
-
31
-
32
-
33
-
34
-
35
-
36
-
37
-
38
-
39
-
40
-
41
-
42
-
43
-
44
-
45
-
46
-
47
-
48
-
49
-
50
-
51
-
52
-
53
-
54
-
55
-
56
-
57
-
58
-
59
-
60
-
61
-
62
-
63
-
64
-
65
-
66
-
67
-
68
-
69
-
70
-
71
-
72
-
73
-
74
-
75
-
76
-
77
-
78
-
79
-
80
-
81
-
82
-
83
-
84
-
85
-
86
-
87
-
88
-
89
-
90
-
91
-
92
-
93
-
94
-
95
-
96
-
97
-
98
-
99
-
100
-
101
-
102
-
103
-
104
-
105
-
106
-
107
-
108
-
109
-
110
-
111
-
112
-
113
-
114
-
115
-
116
-
117
-
118
-
119
-
120
-
121
-
122
-
123
-
124
-
125
-
126
-
127
-
128
-
129
-
130
-
131
-
132
-
133
-
134
-
135
-
136
-
137
-
138
-
139
-
140
-
141
-
142
-
143
-
144
-
145
-
146
-
147
-
148
-
149
-
150
-
151
-
152
-
153
-
154
-
155
-
156
-
157
-
158
-
159
-
160
-
161
-
162
-
163
-
164
-
165
-
166
 |
 |

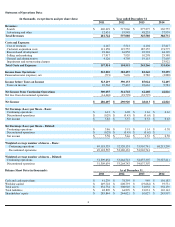
Statement of Operations Data:
(in thousands, except shares and per share data)
Year ended December 31
2011
2012
2013
2014
Revenues:
Search
$
469,293
$
517,060
$
277,275
$
330,757
Advertising and other
12,431
19,948
48,233
57,974
Total Revenues
481,724
537,008
325,508
388,731
Costs and Expenses:
Cost of revenues
4,167
5,513
6,104
27,817
Customer acquisition costs
113,358
119,555
185,355
174,575
Research and development
18,346
16,858
22,394
44,129
Selling and marketing
17,917
7,920
10,298
25,388
General and administrative
4,126
4,705
19,115
37,605
Impairment and restructuring charges
-
-
-
23,922
Total Costs and Expenses
157,914
154,551
243,266
333,436
Income from Operations
323,810
382,457
82,242
55,295
Financial income (expense), net
(591
)
7,696
2,782
(2,888
)
Income before Taxes on Income
323,219
390,153
85,024
52,407
Taxes on income
22,564
75,435
22,616
9,581
Net Income from Continuing Operations
300,655
314,718
62,408
42,826
Net loss from discontinued operations
(14,248
)
(23,798
)
(33,795
)
-
Net Income
$
286,407
$
290,920
$
28,613
$
42,826
Net Earnings (Loss) per Share
-
Basic:
Continuing operations
$
6.12
$
6.02
$
1.16
$
0.63
Discontinued operations
$
(0.29
)
$
(0.45
)
$
(0.63
)
$
-
Net income
$
5.83
$
5.57
$
0.53
$
0.63
Net Earnings (Loss) per Share – Diluted:
Continuing operations
$
5.86
$
5.91
$
1.14
$
0.58
Discontinued operations
$
(0.28
)
$
(0.45
)
$
(0.62
)
$
-
Net income
$
5.58
$
5.46
$
0.52
$
0.58
Weighted average number of shares
–
Basic:
Continuing operations
49,118,535
52,320,133
53,910,741
68,213,209
Discontinued operations
49,118,535
52,320,133
53,910,741
-
Weighted average number of shares
–
Diluted:
Continuing operations
51,309,654
53,264,743
54,837,307
70,327,411
Discontinued operations
51,309,654
53,264,743
54,837,307
-
Balance Sheet Data (in thousands):
As of December 31,
2011
2012
2013
2014
Cash and cash equivalents
$
41,239
$
78,395
$
949
$
101,183
Working capital
$
249,718
$
208,793
$
(19,682
)
$
93,531
Total assets
$
334,734
$
308,920
$
31,058
$
356,139
Total liabilities
$
48,890
$
64,899
$
21,031
$
110,142
Shareholders' equity
$
285,844
$
244,021
$
10,027
$
245,997
4