ING Direct 2006 Annual Report Download - page 11
Download and view the complete annual report
Please find page 11 of the 2006 ING Direct annual report below. You can navigate through the pages in the report by either clicking on the pages listed below, or by using the keyword search tool below to find specific information within the annual report.-
 1
1 -
 2
2 -
 3
3 -
 4
4 -
 5
5 -
 6
6 -
 7
7 -
 8
8 -
 9
9 -
 10
10 -
 11
11 -
 12
12 -
 13
13 -
 14
14 -
 15
15 -
 16
16 -
 17
17 -
 18
18 -
 19
19 -
 20
20 -
 21
21 -
 22
22 -
23
-
24
-
25
-
26
-
27
-
28
-
29
-
30
-
31
-
32
-
33
-
34
-
35
-
36
 |
 |

assets. The solvency ratio (BIS ratio) for the
bank improved to 11.02% at the end of
December 2006 from 10.86% at 1 January
2006. Total risk-weighted assets of the
banking operations increased by EUR 18.3
billion, or 5.7%, to EUR 337.9 billion at
the end of December 2006. See for more
detailed information the chapter on Capital
management.
Divestments and special items
Divestments resulted in a loss after tax of
EUR 85 million in 2006 compared with a gain
of EUR 414 million in 2005. Divested units
contributed EUR 27 million to profi t after tax
in 2006, up from a loss of EUR 21 million a
year earlier. Special items 2005 of EUR 583
million consisted of tax provision releases
and the establishment of deferred tax assets.
Excluding the impact of divestments and
special items, underlying net profi t increased
24.3% to EUR 7,750 million.
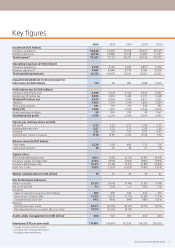
Profi t and loss account
in EUR million 2006 2005 change
Total income 73,621 71,120 3.5%
Total expenditures 63,681 62,226 2.3%
Profi t before tax 9,940 8,894 11.8%
Taxation 1,907 1,379 38.3%
Third-party interests 341 305 11.8%
Net profi t 7,692 7,210 6.7%
Divestments/special items -58 976
Underlying net profi t 7,750 6,234 24.3%
Profi t before tax 9,940 8,894 11.8%
Gains/losses from divestments 63 -366
Profi t from divested units -45 1
Underlying profi t before tax 9,958 8,529 16.8%
Insurance operations
ING’s insurance operations continued to
benefi t from strong growth in retirement
services and life insurance in developing
markets, higher investment results and a
favourable claims environment for the non-
life insurance businesses. Underlying profi t
before tax from insurance rose 22.9% to
EUR 4,886 million.
Underlying profi t before tax from life
insurance increased by 23.0%. The life
insurance activities in the Netherlands,
Latin America and Asia showed strong
profi t growth, supported by increased
sales, growth in assets under management
and investment gains. The underlying
profi t before tax from non-life insurance
went up 22.7%, driven by higher results
in the Netherlands and benefi ting from
a favourable underwriting cycle. Canada
showed lower but still good results, due to
less favourable developments in prior-year
reserves and lower investment related gains.
Underlying premium income increased
2.5% to EUR 46,834 million. Life premiums
of total insurance increased 2.3%, or 3.3%
excluding currency effects, mainly driven
by strong growth of life premiums in
Central and Rest of Europe, the US, Latin
America and Australia. In the Netherlands
and Belgium life premiums declined, while
in Asia, growth in life premiums in all
countries, especially Korea and Taiwan,
was more than offset by Japan, which
showed a signifi cant drop in premiums.
Non-life premiums increased 3.8%, or
1.1% excluding currency effects, as lower
premiums in the Netherlands were more
than offset by higher premiums in all
other regions, especially in Canada and
Latin America.
Operating expenses from the insurance
operations increased 2.0% to EUR 5,275
million. Recurring expenses increased with
6.1% to EUR 5,252 million, as the non-
recurring part of the expenses was much
higher in 2005 (IT expenses, reorganisation
costs, SOX implementation and other
projects). The recurring expense growth
was mainly caused by costs to support
the ongoing growth of the business,
particularly in Asia.
0
2
4
6
8
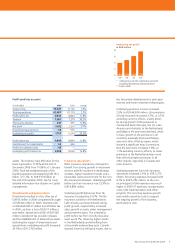
Underlying net profit*
in EUR million
4,053 4,959 6,234 7,750
* Underlying net profit is defined as net profit
excluding divestments and special items.
** Dutch GAAP.
03**
04 05 06
ING Group Annual Review 2006 9