Humana 2015 Annual Report Download - page 5
Download and view the complete annual report
Please find page 5 of the 2015 Humana annual report below. You can navigate through the pages in the report by either clicking on the pages listed below, or by using the keyword search tool below to find specific information within the annual report.-
 1
1 -
 2
2 -
 3
3 -
 4
4 -
 5
5 -
 6
6 -
 7
7 -
 8
8 -
 9
9 -
 10
10 -
 11
11 -
 12
12 -
 13
13 -
 14
14 -
 15
15 -
 16
16 -
17
-
18
-
19
-
20
-
21
-
22
-
23
-
24
-
25
-
26
-
27
-
28
-
29
-
30
-
31
-
32
-
33
-
34
-
35
-
36
-
37
-
38
-
39
-
40
-
41
-
42
-
43
-
44
-
45
-
46
-
47
-
48
-
49
-
50
-
51
-
52
-
53
-
54
-
55
-
56
-
57
-
58
-
59
-
60
-
61
-
62
-
63
-
64
-
65
-
66
-
67
-
68
-
69
-
70
-
71
-
72
-
73
-
74
-
75
-
76
-
77
-
78
-
79
-
80
-
81
-
82
-
83
-
84
-
85
-
86
-
87
-
88
-
89
-
90
-
91
-
92
-
93
-
94
-
95
-
96
-
97
-
98
-
99
-
100
-
101
-
102
-
103
-
104
-
105
-
106
-
107
-
108
-
109
-
110
-
111
-
112
-
113
-
114
-
115
-
116
-
117
-
118
-
119
-
120
-
121
-
122
-
123
-
124
-
125
-
126
-
127
-
128
-
129
-
130
-
131
-
132
-
133
-
134
-
135
-
136
-
137
-
138
-
139
-
140
-
141
-
142
-
143
-
144
-
145
-
146
-
147
-
148
-
149
-
150
-
151
-
152
-
153
-
154
-
155
-
156
-
157
-
158
-
159
-
160
-
161
-
162
-
163
-
164
-
165
-
166
 |
 |

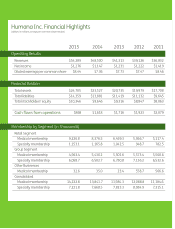
2015 Annual Report 3
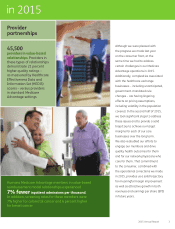
45,500
providers in value-based
relationships. Providers in
these types of relationships
demonstrate 21 percent
higher quality ratings –
as measured by Healthcare
Effectiveness Data and
Information Set (HEDIS)
scores – versus providers
in standard Medicare
Advantage settings
Humana Medicare Advantage members in value-based
reimbursement model relationships experienced
7% fewer inpatient admissions per thousand.
In addition, screening rates for these members were
7% higher for colorectal cancer and 6 percent higher
for breast cancer
Provider
partnerships
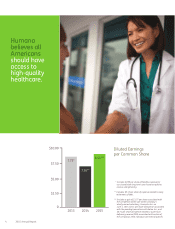
Although we were pleased with
the progress we made last year
on the consumer front, at the
same time we had to address
certain challenges in our Medicare
Advantage operations in 2015.
Additionally, complexities associated
with the healthcare exchange
businesses – including unanticipated,
government-mandated rule
changes – are having lingering
effects on pricing assumptions,
including volatility in the population
covered. In the second half of 2015,
we took significant steps to address
these issues and to provide a solid
trajectory to achieve our target
margins for each of our core
businesses over the long term.
We also redoubled our efforts to
engage our members and drive
quality health outcomes for them
and for our network physicians who
care for them. That commitment
to the consumer, combined with
the operational corrections we made
in 2015, provides us a solid trajectory
for meaningful margin improvement
as well as attractive growth in both
revenues and earnings per share (EPS)
in future years.
in 2015