Humana 2015 Annual Report Download - page 13
Download and view the complete annual report
Please find page 13 of the 2015 Humana annual report below. You can navigate through the pages in the report by either clicking on the pages listed below, or by using the keyword search tool below to find specific information within the annual report.-
 1
1 -
2
-
 3
3 -
 4
4 -
 5
5 -
 6
6 -
 7
7 -
 8
8 -
 9
9 -
 10
10 -
 11
11 -
 12
12 -
 13
13 -
 14
14 -
 15
15 -
 16
16 -
 17
17 -
 18
18 -
 19
19 -
 20
20 -
 21
21 -
 22
22 -
 23
23 -
24
-
25
-
26
-
27
-
28
-
29
-
30
-
31
-
32
-
33
-
34
-
35
-
36
-
37
-
38
-
39
-
40
-
41
-
42
-
43
-
44
-
45
-
46
-
47
-
48
-
49
-
50
-
51
-
52
-
53
-
54
-
55
-
56
-
57
-
58
-
59
-
60
-
61
-
62
-
63
-
64
-
65
-
66
-
67
-
68
-
69
-
70
-
71
-
72
-
73
-
74
-
75
-
76
-
77
-
78
-
79
-
80
-
81
-
82
-
83
-
84
-
85
-
86
-
87
-
88
-
89
-
90
-
91
-
92
-
93
-
94
-
95
-
96
-
97
-
98
-
99
-
100
-
101
-
102
-
103
-
104
-
105
-
106
-
107
-
108
-
109
-
110
-
111
-
112
-
113
-
114
-
115
-
116
-
117
-
118
-
119
-
120
-
121
-
122
-
123
-
124
-
125
-
126
-
127
-
128
-
129
-
130
-
131
-
132
-
133
-
134
-
135
-
136
-
137
-
138
-
139
-
140
-
141
-
142
-
143
-
144
-
145
-
146
-
147
-
148
-
149
-
150
-
151
-
152
-
153
-
154
-
155
-
156
-
157
-
158
-
159
-
160
-
161
-
162
-
163
-
164
-
165
-
166
 |
 |

5
We manage our business with three reportable segments: Retail, Group, and Healthcare Services. In addition, the
Other Businesses category includes businesses that are not individually reportable because they do not meet the
quantitative thresholds required by generally accepted accounting principles. These segments are based on a combination
of the type of health plan customer and adjacent businesses centered on well-being solutions for our health plans and
other customers, as described below. These segment groupings are consistent with information used by our Chief
Executive Officer to assess performance and allocate resources.
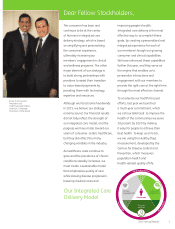
Our Products
Our medical and specialty insurance products allow members to access health care services primarily through our
networks of health care providers with whom we have contracted. These products may vary in the degree to which
members have coverage. Health maintenance organizations, or HMOs, generally require a referral from the member’s
primary care provider before seeing certain specialty physicians. Preferred provider organizations, or PPOs, provide
members the freedom to choose a health care provider without requiring a referral. However PPOs generally require
the member to pay a greater portion of the provider’s fee in the event the member chooses not to use a provider
participating in the PPO’s network. Point of Service, or POS, plans combine the advantages of HMO plans with the
flexibility of PPO plans. In general, POS plans allow members to choose, at the time medical services are needed, to
seek care from a provider within the plan’s network or outside the network. In addition, we offer services to our health
plan members as well as to third parties that promote health and wellness, including pharmacy solutions, provider,
home based, and clinical programs, as well as services and capabilities to advance population health. At the core of our
strategy is our integrated care delivery model, which unites quality care, high member engagement, and sophisticated
data analytics. Three core elements of the model are to improve the consumer experience by simplifying the interaction
with us, engaging members in clinical programs, and offering assistance to providers in transitioning from a fee-for-
service to a value-based arrangement. Our approach to primary, physician-directed care for our members aims to provide
quality care that is consistent, integrated, cost-effective, and member-focused. The model is designed to improve health
outcomes and affordability for individuals and for the health system as a whole, while offering our members a simple,
seamless healthcare experience. The discussion that follows describes the products offered by each of our segments.
Our Retail Segment Products
This segment is comprised of products sold on a retail basis to individuals including medical and supplemental
benefit plans described in the discussion that follows. The following table presents our premiums and services revenue
for the Retail segment by product for the year ended December 31, 2015:
Retail Segment
Premiums and
Services Revenue
Percent of
Consolidated
Premiums and
Services Revenue
(dollars in millions)
Premiums:
Individual Medicare Advantage $ 29,526 54.9%
Group Medicare Advantage 5,588 10.4%
Medicare stand-alone PDP 3,846 7.1%
Total Medicare 38,960 72.4%
Individual commercial 4,243 7.9%
State-based Medicaid 2,341 4.3%
Individual specialty 261 0.5%
Total premiums 45,805 85.1%
Services 9—%
Total premiums and services revenue $ 45,814 85.1%