HollyFrontier 2015 Annual Report Download - page 4
Download and view the complete annual report
Please find page 4 of the 2015 HollyFrontier annual report below. You can navigate through the pages in the report by either clicking on the pages listed below, or by using the keyword search tool below to find specific information within the annual report.-
 1
1 -
 2
2 -
 3
3 -
 4
4 -
 5
5 -
 6
6 -
 7
7 -
 8
8 -
 9
9 -
 10
10 -
 11
11 -
 12
12 -
 13
13 -
 14
14 -
 15
15 -
16
-
17
-
18
-
19
-
20
-
21
-
22
-
23
-
24
-
25
-
26
-
27
-
28
-
29
-
30
-
31
-
32
-
33
-
34
-
35
-
36
-
37
-
38
-
39
-
40
-
41
-
42
-
43
-
44
-
45
-
46
-
47
-
48
-
49
-
50
-
51
-
52
-
53
-
54
-
55
-
56
-
57
-
58
-
59
-
60
-
61
-
62
-
63
-
64
-
65
-
66
-
67
-
68
-
69
-
70
-
71
-
72
-
73
-
74
-
75
-
76
-
77
-
78
-
79
-
80
-
81
-
82
-
83
-
84
-
85
-
86
-
87
-
88
-
89
-
90
-
91
-
92
-
93
-
94
-
95
-
96
-
97
-
98
-
99
-
100
-
101
-
102
-
103
-
104
-
105
-
106
-
107
-
108
-
109
-
110
-
111
-
112
-
113
-
114
-
115
-
116
-
117
-
118
-
119
-
120
-
121
-
122
 |
 |

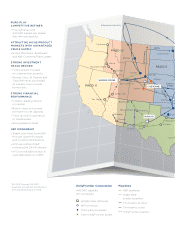
Phoenix
Tucson
Las Vegas
Denver
Burley
Casper
Billings
Boise
Mountain Home
Salt Lake City
Spokane
Houston
Edmonton Hardisty
Grand Forks
Guernsey
Omaha
Express
Platte
Porta
Jayhawk
Texaco/Butte
Sidney
Wichita
Cushing
Moriarty
Wichita F
Bloomfield
Cedar City
Abilene
Orla
El Paso
Duncan
Albuquerque
PADD IV
PADD V
PADD II
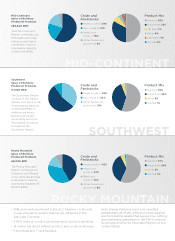
NAVAJO
WOODS CROSS
CHEYENNE
PURE-PLAY
COMPETITIVE REFINER
• Five refineries with
443,000 barrels per stream
day refining capacity
ATTRACTIVE NICHE PRODUCT
MARKETS WITH ADVANTAGED
CRUDE SUPPLY
• Rocky Mountains, Southwest
and Mid-Continent/Plains states
STRONG INVESTMENT
TRACK RECORD
• Future growth focused
on underwritten projects
• Woods Cross, El Dorado and
Tulsa Refineries purchased
at industry lows on a per
barrel basis
STRONG FINANCIAL
PERFORMANCE
• Industry-leading returns
on capital
• Best-in-class net income
per barrel crude capacity
• Track record of cash return
to shareholders
• Strong balance sheet
HEP OWNERSHIP
• Stable cash flows from HEP
through quarterly regular
and incentive distributions
• HFC owns 39% of HEP
including the 2% GP interest
• HFC received $90 million in
cash distributions in 2015*
* Q4 2014 through Q3 2015
quarterly LP and GP distributions,
announced and paid in 2015
Pipelines
HEP pipelines
UNEV HEP
product pipeline
Third-party product
Third-party crude
HollyFrontier pipeline
HollyFrontier Corporation
443,000 capacity
12.1 complexity
HollyFrontier refineries
HEP terminals
Third-party terminals
Other HollyFrontier assets