HollyFrontier 2013 Annual Report Download - page 3
Download and view the complete annual report
Please find page 3 of the 2013 HollyFrontier annual report below. You can navigate through the pages in the report by either clicking on the pages listed below, or by using the keyword search tool below to find specific information within the annual report.-
 1
1 -
 2
2 -
 3
3 -
 4
4 -
 5
5 -
 6
6 -
 7
7 -
 8
8 -
 9
9 -
 10
10 -
 11
11 -
 12
12 -
 13
13 -
 14
14 -
15
-
16
-
17
-
18
-
19
-
20
-
21
-
22
-
23
-
24
-
25
-
26
-
27
-
28
-
29
-
30
-
31
-
32
-
33
-
34
-
35
-
36
-
37
-
38
-
39
-
40
-
41
-
42
-
43
-
44
-
45
-
46
-
47
-
48
-
49
-
50
-
51
-
52
-
53
-
54
-
55
-
56
-
57
-
58
-
59
-
60
-
61
-
62
-
63
-
64
-
65
-
66
-
67
-
68
-
69
-
70
-
71
-
72
-
73
-
74
-
75
-
76
-
77
-
78
-
79
-
80
-
81
-
82
-
83
-
84
-
85
-
86
-
87
-
88
-
89
-
90
-
91
-
92
-
93
-
94
-
95
-
96
-
97
-
98
-
99
-
100
-
101
-
102
-
103
-
104
-
105
-
106
-
107
-
108
-
109
-
110
-
111
-
112
-
113
-
114
-
115
-
116
-
117
-
118
-
119
-
120
-
121
-
122
-
123
-
124
-
125
-
126
 |
 |

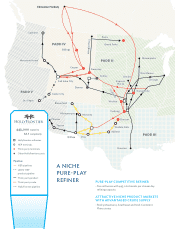
PADD I
PADD I
Proximity to Growing
North American Crude Production
All five HFC refineries sit close
to production growth.
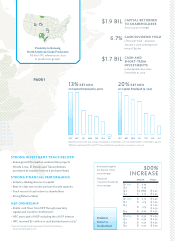
Increased regular
dividend 5 times
since merger.
Declared
11 special dividends
since merger.
Based on 5-year and 3-year averages calculated as stockholders’ net income/(total debt + stockholders’ equity).
* Reflects combined HOC and FTO financial data for periods prior to merger in July 2011.
STRONG INVESTMENT TRACK RECORD
• Future growth focused on underwritten projects
• Woods Cross, El Dorado and Tulsa refineries
purchased at industry lows on a per barrel basis
STRONG FINANCIAL PERFORMANCE
• Industry-leading returns on capital
• Best-in-class net income per barrel crude capacity
• Track record of cash return to shareholders
• Strong Balance Sheet
HEP OWNERSHIP
• Stable cash flows from HEP through quarterly
regular and incentive distributions
• HFC owns 39% of HEP including the 2% GP interest
• HFC received $71 million in cash distributions in 2013*
*Q4 2012 through Q3 2013 quarterly LP and GP distributions,
announced and paid in 2013
INCREASE
REGULAR SPECIAL
Q 1 2011 $ 0.75 –
Q 2 $ 0.75 –
Q 3 $ 0.0875 $ 0.50
Q 4 $ 0.10 $ 0.50
Q 1 2012 $ 0.10 $ 0.50
Q 2 $ 0.15 $ 0.50
Q 3 $ 0.15 $ 0.50
$ 0.50
Q 4 $ 0.20 $ 0.50
Q 1
2013 $ 0.30 $ 0.50
Q 2 $ 0.30 $ 0.50
Q 3 $ 0.30 $ 0.50
Q 4 $ 0.30 $ 0.50
Dividend
Return to
Stockholders
RETURN
on Capital Employed (5-year)
HFC* MPC DK WNR TSO VLO ALJ
RETURN
on Capital Employed (3-year)
HFC* MPC WNR DK TSO VLO ALJ
CAPITAL RETURNED
TO SHAREHOLDERS
Since July 2011 merger
CASH DIVIDEND YIELD
LTM Cash Yield – based on
January 2, 2013 opening stock
price of $47.69
CASH AND
SHORTTERM
INVESTMENTS
in Marketable Securities
December 31, 2013
. BIL
. BIL
.