HR Block 2007 Annual Report Download - page 4
Download and view the complete annual report
Please find page 4 of the 2007 HR Block annual report below. You can navigate through the pages in the report by either clicking on the pages listed below, or by using the keyword search tool below to find specific information within the annual report.-
 1
1 -
 2
2 -
 3
3 -
 4
4 -
 5
5 -
 6
6 -
 7
7 -
 8
8 -
 9
9 -
 10
10 -
 11
11 -
 12
12 -
 13
13 -
 14
14 -
 15
15 -
16
-
17
-
18
-
19
-
20
-
21
-
22
-
23
-
24
-
25
-
26
-
27
-
28
-
29
-
30
-
31
-
32
-
33
-
34
-
35
-
36
-
37
-
38
-
39
-
40
-
41
-
42
-
43
-
44
-
45
-
46
-
47
-
48
-
49
-
50
-
51
-
52
-
53
-
54
-
55
-
56
-
57
-
58
-
59
-
60
-
61
-
62
-
63
-
64
-
65
-
66
-
67
-
68
-
69
-
70
-
71
-
72
-
73
-
74
-
75
-
76
-
77
-
78
-
79
-
80
-
81
-
82
-
83
-
84
-
85
-
86
-
87
-
88
-
89
-
90
-
91
-
92
-
93
-
94
-
95
-
96
-
97
-
98
-
99
-
100
-
101
-
102
-
103
-
104
-
105
-
106
-
107
-
108
-
109
-
110
-
111
-
112
-
113
-
114
-
115
-
116
-
117
-
118
-
119
-
120
-
121
-
122
-
123
-
124
-
125
-
126
-
127
-
128
-
129
-
130
-
131
-
132
-
133
 |
 |

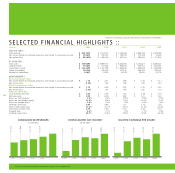
2
$2,528
2003
$2,8
200
$3,
2005
$3,5 5
200
$ 4 , 0 2 1
2 0 0 7
CONSOLIDATED REVENUES
$74
2003
$27
2004
$320
200
$2
200
$374
2007
CONSOLIDATED NET INCOME
$0.20
2003
$0.
200
$0.
200
$0.
200
$1.15
2007
DILUTED EARNINGS PER SHARE
SELECTED FINANCIAL HIGHLIGHTS ::
April 30 2007 2006 2005 2004 2003
FOR THE YEAR ::
Total revenues $ 4,021,274 $ 3,574,753 $ 3,146,369 $ 2,895,786 $ 2,528,395
Net income before discontinued operations and change in accounting principle $374,337$ 297,541 $ 319,749 $ 275,769 $ 74,434
Net income (loss) $(433,653)$ 490,408 $ 623,910 $ 694,093 $ 477,615
AT YEAR END ::
Total assets $ 7,499,493$ 5,989,135 $ 5,538,056 $ 5,233,827 $ 4,666,502
Long-term debt $519,807 $ 417,262 $ 922,933 $ 545,811 $ 822,287
Stockholders’equity $ 1,414,499 $ 2,147,799 $ 1,949,268 $ 1,804,659 $ 1,589,398
Shares outstanding 323,219326,326 331,240 346,192 359,202
Number of shareholders 29,67531,435 30,839 29,430 30,716
MEASUREMENTS ::
Basic earnings per share
Net income before discontinued operations and change in accounting principle $ 1.16$ 0.91 $ 0.96 $ 0.78 $ 0.21
Net income (loss) (1.34)1.49 1.88 1.96 1.33
Diluted earnings per share
Net income before discontinued operations and change in accounting principle $ 1.15$ 0.89 $ 0.95 $ 0.76 $ 0.20
Net income (loss) (1.33)1.47 1.85 1.92 1.30
Other per share data
Cash dividends declared $ 0.53$ 0.49 $ 0.43 $ 0.39 $ 0.35
Net book value $ 4.38$ 6.58 $ 5.88 $ 5.21 $ 4.42
Return on total revenues19.3%8.3%10.2%9.5%2.9%
Return on stockholders’equity121.0%14.5%17.0%16.3%5.0%
Return on average assets15.6%5.2%5.9%5.6%1.6%
Working capital ratio 0.670.96 1.37 1.18 1.36
Debt to total capital ratio 27.2%30.1%32.7%31.3%35.6%
Total equity to total assets 0.190.36 0.35 0.34 0.34
Dividend yield 2.4%2.1%1.7%1.7%1.8%
Dividend payout ratio -39.7%32.6%22.5%19.5%26.4%
1Data are for continuing operations and before change in accounting principle.
Amounts in thousands, except per share amounts and number of shareholders