GameStop 2015 Annual Report Download - page 3
Download and view the complete annual report
Please find page 3 of the 2015 GameStop annual report below. You can navigate through the pages in the report by either clicking on the pages listed below, or by using the keyword search tool below to find specific information within the annual report.-
 1
1 -
 2
2 -
 3
3 -
 4
4 -
 5
5 -
 6
6 -
 7
7 -
 8
8 -
 9
9 -
 10
10 -
 11
11 -
 12
12 -
 13
13 -
 14
14 -
15
-
16
-
17
-
18
-
19
-
20
-
21
-
22
-
23
-
24
-
25
-
26
-
27
-
28
-
29
-
30
-
31
-
32
-
33
-
34
-
35
-
36
-
37
-
38
-
39
-
40
-
41
-
42
-
43
-
44
-
45
-
46
-
47
-
48
-
49
-
50
-
51
-
52
-
53
-
54
-
55
-
56
-
57
-
58
-
59
-
60
-
61
-
62
-
63
-
64
-
65
-
66
-
67
-
68
-
69
-
70
-
71
-
72
-
73
-
74
-
75
-
76
-
77
-
78
-
79
-
80
-
81
-
82
-
83
-
84
-
85
-
86
-
87
-
88
-
89
-
90
-
91
-
92
-
93
-
94
-
95
-
96
-
97
-
98
-
99
-
100
-
101
-
102
-
103
-
104
-
105
-
106
-
107
-
108
-
109
 |
 |

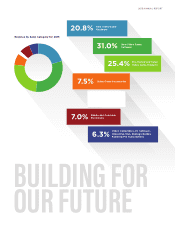
Revenue by Sales Category for 2015
20.8% New Video Game
Hardware
31.0%
New Video Game
Software
7.5%
Video Game Accessories
2.0%
Digital
7.0%
Mobile and Consumer
Electronics
6.3%
Other: Collectibles, PC Software,
Interactive Toys, Strategy Guides,
PowerUp Pro Subscriptions
25.4%
Pre-Owned and Value
Video Game Products
BUILDING FOR
OUR FUTURE
1
2015 ANNUAL REPORT