GameStop 2015 Annual Report Download - page 10
Download and view the complete annual report
Please find page 10 of the 2015 GameStop annual report below. You can navigate through the pages in the report by either clicking on the pages listed below, or by using the keyword search tool below to find specific information within the annual report.-
 1
1 -
 2
2 -
 3
3 -
 4
4 -
 5
5 -
 6
6 -
 7
7 -
 8
8 -
 9
9 -
 10
10 -
 11
11 -
 12
12 -
 13
13 -
 14
14 -
 15
15 -
 16
16 -
 17
17 -
 18
18 -
 19
19 -
 20
20 -
 21
21 -
22
-
23
-
24
-
25
-
26
-
27
-
28
-
29
-
30
-
31
-
32
-
33
-
34
-
35
-
36
-
37
-
38
-
39
-
40
-
41
-
42
-
43
-
44
-
45
-
46
-
47
-
48
-
49
-
50
-
51
-
52
-
53
-
54
-
55
-
56
-
57
-
58
-
59
-
60
-
61
-
62
-
63
-
64
-
65
-
66
-
67
-
68
-
69
-
70
-
71
-
72
-
73
-
74
-
75
-
76
-
77
-
78
-
79
-
80
-
81
-
82
-
83
-
84
-
85
-
86
-
87
-
88
-
89
-
90
-
91
-
92
-
93
-
94
-
95
-
96
-
97
-
98
-
99
-
100
-
101
-
102
-
103
-
104
-
105
-
106
-
107
-
108
-
109
 |
 |

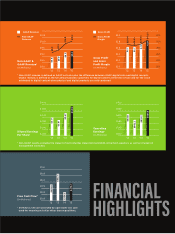
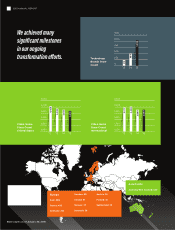
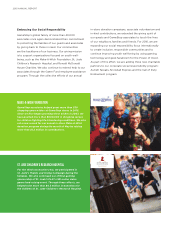
Dominating the Video Game Category
2015 proved to be another solid year for our global video
game business. We maximized the global footprint of
our more than approximately 6,100 video game stores
around the world by creating a social community where
gamers of all kinds — from casual to serious, console
to PC — can discover the magic of video games. This
enabled us to hold the dominant market share position
in the global video game market and increase our
consolidated same store sales for the third consecutive
year. We achieved this by driving the global adoption
of next-gen hardware and software, providing our 46
million PowerUp Rewards members around the world
with unique and personalized promotional and trade-in
programs, and oering exclusive products and content
for both current-gen and next-gen gaming products.
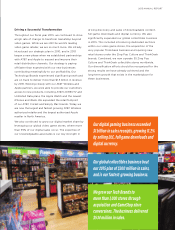
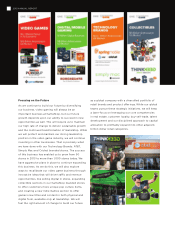
In our pre-owned business, we issued more than $1
billion in trade credits, helping our customers fund the
purchase of their video game merchandise as part of
our buy-sell-trade program. We introduced two new
channels as part of our omni-channel business — web-
in-store and ship-from-store. Both performed well,
allowing us to leverage our diverse product oerings
across the business. While our physical stores continued
to be the channel where the real magic occurred, overall
our omni-channel business saw a 45% growth in revenue
versus 2014.
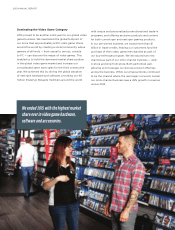
We ended 2015 with the highest market
share ever in video game hardware,
software and accessories.
82015 ANNUAL REPORT