GameStop 2015 Annual Report Download - page 2
Download and view the complete annual report
Please find page 2 of the 2015 GameStop annual report below. You can navigate through the pages in the report by either clicking on the pages listed below, or by using the keyword search tool below to find specific information within the annual report.-
 1
1 -
 2
2 -
 3
3 -
 4
4 -
 5
5 -
 6
6 -
 7
7 -
 8
8 -
 9
9 -
 10
10 -
 11
11 -
 12
12 -
 13
13 -
14
-
15
-
16
-
17
-
18
-
19
-
20
-
21
-
22
-
23
-
24
-
25
-
26
-
27
-
28
-
29
-
30
-
31
-
32
-
33
-
34
-
35
-
36
-
37
-
38
-
39
-
40
-
41
-
42
-
43
-
44
-
45
-
46
-
47
-
48
-
49
-
50
-
51
-
52
-
53
-
54
-
55
-
56
-
57
-
58
-
59
-
60
-
61
-
62
-
63
-
64
-
65
-
66
-
67
-
68
-
69
-
70
-
71
-
72
-
73
-
74
-
75
-
76
-
77
-
78
-
79
-
80
-
81
-
82
-
83
-
84
-
85
-
86
-
87
-
88
-
89
-
90
-
91
-
92
-
93
-
94
-
95
-
96
-
97
-
98
-
99
-
100
-
101
-
102
-
103
-
104
-
105
-
106
-
107
-
108
-
109
 |
 |

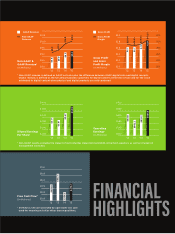
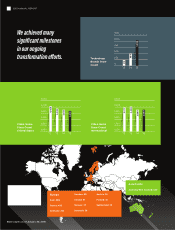
FINANCIAL
HIGHLIGHTS
Diluted Earnings
Per Share*
’12 ’13 ’14 ’15 ’12 ’13 ’14 ’15
Operating
Earnings*
(In Millions)
* Non-GAAP results; excludes the impact of restructuring, impairment and debt-retirement expenses, as well as changes in
management estimates.
* Non-GAAP revenue is defined as GAAP net sales plus the dierence between GAAP digital sales and digital receipts.
Digital receipts is defined as the full amount paid by customers for digital content at the time of sale and for the value
attributed to digital content when physical and digital products are sold combined.
$2.00 $500
$2.40 $540
$2.80 $580
$3.20 $620
$3.60 $660
$4.00 $700
Non-GAAP &
GAAP Revenue*
(In Millions)
Gross Profit
and Gross
Profit Margin
(In Millions)
’12 ’13 ’14 ’15 ’12 ’13 ’14 ’15
$8.9
$2.7
$9.3
$29.8%
GAAP Revenue
Non-GAAP
Revenue
Gross Profit
Gross Profit
Margin
$9.0
$2.7
$9.5
$29.4%
$9.3
$2.8
$10.0
$29.9%
$9.4
$2.9
$10.2
$31.2%
$8.0 $2.0 22%
$8.5 $2.2 24%
$9.0 $2.4 26%
$9.5 $2.6 28%
$10.0 $2.8 30%
$10.5 $3.0 32%
$3.17
$3.01
$3.47
$3.90
$639.1
$602.2
$635.3
$665.6
’12 ’13 ’14 ’15
* Defined as net cash provided by operations less cash
used for investing activities other than acquisitions.
Free Cash Flow*
(In Millions) $200
$300
$400
$500
$600
$700
$459.0
$632.6
$334.3
$479.7