Foot Locker 2006 Annual Report Download - page 26
Download and view the complete annual report
Please find page 26 of the 2006 Foot Locker annual report below. You can navigate through the pages in the report by either clicking on the pages listed below, or by using the keyword search tool below to find specific information within the annual report.-
 1
1 -
2
-
3
-
4
-
5
-
6
-
7
-
8
-
9
-
10
-
11
-
12
-
13
-
14
-
15
-
 16
16 -
 17
17 -
 18
18 -
 19
19 -
 20
20 -
 21
21 -
 22
22 -
 23
23 -
 24
24 -
 25
25 -
 26
26 -
 27
27 -
 28
28 -
 29
29 -
 30
30 -
 31
31 -
 32
32 -
 33
33 -
 34
34 -
 35
35 -
 36
36 -
37
-
38
-
39
-
40
-
41
-
42
-
43
-
44
-
45
-
46
-
47
-
48
-
49
-
50
-
51
-
52
-
53
-
54
-
55
-
56
-
57
-
58
-
59
-
60
-
61
-
62
-
63
-
64
-
65
-
66
-
67
-
68
-
69
-
70
-
71
-
72
-
73
-
74
-
75
-
76
-
77
-
78
-
79
-
80
-
81
-
82
-
83
-
84
-
85
-
86
-
87
-
88
-
89
-
90
-
91
-
92
-
93
-
94
-
95
-
96
 |
 |

10
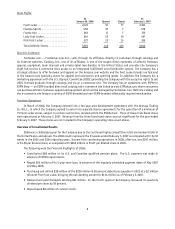
Sales of $5,653 million in 2005 increased by 5.6 percent from sales of $5,355 million in 2004. The effect of
foreign currency fluctuations on sales was not significant. This increase was primarily related to increased sales in the
Company’s Footaction and Champs Sports formats. Comparable-store sales increased by 2.7 percent.
Gross Margin
Gross margin as a percentage of sales was 30.2 percent in 2006; excluding the effect of the 53rd week, gross margin
declined 20 basis points as compared with 2005. This reflects increased promotional activity, offset, in part, by the
effect of increased vendor allowances. The effect of these vendor allowances was an improvement in gross margin in
2006, as a percentage of sales, of 20 basis points as compared with 2005. Additionally, gross margin was negatively
affected by lower sales, which resulted in increased occupancy costs, as a percentage of sales.
Gross margin as a percentage of sales was 30.2 percent in 2005, decreasing by 30 basis points from 30.5 percent
in 2004. This decline was primarily the result of increased markdowns recorded by the European operation. The effect
of vendor allowances on gross margin, as a percentage of sales, as compared with the corresponding prior year period
was not significant.
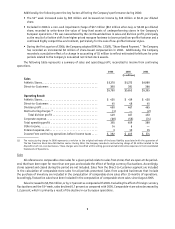
Corporate Expense
Corporate expense consists of unallocated general and administrative expenses, as well as depreciation and
amortization related to the Company’s corporate headquarters, centrally managed departments, unallocated insurance
and benefit programs, certain foreign exchange transaction gains and losses and other items.
The increase in corporate expense in 2006 as compared with 2005 of $10 million reflects the adoption of SFAS
No. 123(R) that resulted in incremental compensation expense of $6 million and a charge of $4 million for anticipated
settlements of certain legal matters. The effect of the 53rd week on corporate expense was not significant. Depreciation
and amortization included in corporate expense amounted to $22 million in 2006, $24 million in 2005, and $23 million
in 2004.
The decrease in corporate expense in 2005 as compared with 2004 primarily included decreased incentive bonuses
of $14 million; a $3 million decrease in costs associated with the Company’s loyalty program, as 2004 represented the
initial costs to launch the program; and decreased restricted stock expense of $2 million. In addition, 2004 included
$5 million for the integration of the Footaction stores. Included in 2005 was also a settlement of $3 million pursuant
to a class action settlement with Visa and MasterCard related to past overcharges for certain debit card transactions.
These decreases were offset, in part, by a charge of $4 million due to the potential insolvency of one of the Company’s
insurance carriers and legal and settlement costs of $5 million.
Other Income
During 2006, the Company terminated two of its leases for approximately $5 million, which resulted in a net gain
of $4 million. In addition, the Company finalized its insurance claims related to Hurricane Katrina, which resulted in a
gain of $8 million, which represents amounts in excess of losses. Also during 2006, the Company purchased and retired
$38 million of long-term debt at a discount from face value of $2 million. The 2005 amounts represent $3 million related
to the insurance recoveries associated with Hurricane Katrina, as well as $3 million of a net gain on foreign currency
option contracts that were entered into by the Company to mitigate the effect of fluctuating foreign exchange rates
on the reporting of euro-denominated earnings.
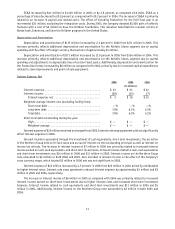
Selling, General and Administrative Expenses
Selling, general and administrative (“SG&A”) expenses increased by $34 million to $1,163 million in 2006, or by 3.0
percent, as compared with 2005. SG&A as a percentage of sales increased to 20.2 percent as compared with 20.0 percent
in 2005. Excluding the effect of foreign currency fluctuations and the 53rd week, SG&A would have increased by 1.4
percent. This increase is primarily the result of incremental share-based compensation included in corporate expense,
associated with the adoption of SFAS No. 123(R) of $6 million. Additionally, the net benefit cost for the Company’s
pension and postretirement plans reflected a reduction of $5 million, primarily as a result of additional contributions
and improved pension fund asset performance.