Express Scripts 2010 Annual Report Download - page 2
Download and view the complete annual report
Please find page 2 of the 2010 Express Scripts annual report below. You can navigate through the pages in the report by either clicking on the pages listed below, or by using the keyword search tool below to find specific information within the annual report.-
 1
1 -
 2
2 -
 3
3 -
 4
4 -
 5
5 -
 6
6 -
 7
7 -
 8
8 -
 9
9 -
 10
10 -
 11
11 -
 12
12 -
 13
13 -
14
-
15
-
16
-
17
-
18
-
19
-
20
-
21
-
22
-
23
-
24
-
25
-
26
-
27
-
28
-
29
-
30
-
31
-
32
-
33
-
34
-
35
-
36
-
37
-
38
-
39
-
40
-
41
-
42
-
43
-
44
-
45
-
46
-
47
-
48
-
49
-
50
-
51
-
52
-
53
-
54
-
55
-
56
-
57
-
58
-
59
-
60
-
61
-
62
-
63
-
64
-
65
-
66
-
67
-
68
-
69
-
70
-
71
-
72
-
73
-
74
-
75
-
76
-
77
-
78
-
79
-
80
-
81
-
82
-
83
-
84
-
85
-
86
-
87
-
88
-
89
-
90
-
91
-
92
-
93
-
94
-
95
-
96
-
97
-
98
-
99
-
100
-
101
-
102
 |
 |

Financial Highlights
(in millions, except per share data) 2010 2009 % Change
Statement of Operations:
Revenues $ 44,973.2 $ 24,722.3 82%
Income before income taxes 1,908.7 1,308.4 46%
Net income from continuing operations 1,204.6 826.6 46%
Per Diluted Share Data:
Net income from continuing operations $ 2.21 $ 1.55 43%
Average Diluted Shares Outstanding 544.0 532.2 2%
Balance Sheet Data:
Cash $ 523.7 $ 1,070.4 -51%
Total assets 10,557.8 11,931.2 -12%
Total debt, including current maturities 2,493.8 3,832.6 -35%
Stockholders’ equity 3,606.6 3,551.8 2%
Net Cash Provided by Operating Activities
—
continuing operations $ 2,105.1 $ 1,752.0 20%
Selected Data:
Total adjusted claims 753.9 530.6 42%
Express Scripts serves tens of millions of Americans as a pharmacy benefi t manager (PBM)
for health maintenance organizations, health insurers, employers, union-sponsored benefi t
plans, third-party administrators, and workers’ compensation and government health programs.
Our focus is driving out waste while improving health outcomes by coordinating the
distribution of prescription drugs. We offer a combination of services, including clinical
management programs, retail drug card programs, home delivery of maintenance medications
from the Express Scripts Pharmacy, formulary management programs, and specialty patient
care and clinical programs spanning both the pharmacy and medical benefi t to enhance care
and reduce waste.
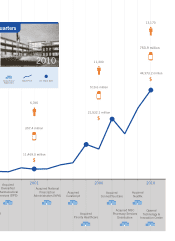
06 06 0607 07 0708 08 0809 09 09
10 10 10
Net Income
from continuing operations
(in millions)
Cash Flow
from continuing operations
(in millions)
Earnings Per Share
from continuing operations
$473
$666 $841
$1,091
$1,752
$2,105
$0.83
$1.13
$1.54 $1.55
$2.21
$598
$776 $827
$1,205