Experian 2011 Annual Report Download - page 50
Download and view the complete annual report
Please find page 50 of the 2011 Experian annual report below. You can navigate through the pages in the report by either clicking on the pages listed below, or by using the keyword search tool below to find specific information within the annual report.-
 1
1 -
2
-
3
-
4
-
5
-
6
-
7
-
8
-
9
-
10
-
11
-
12
-
13
-
14
-
15
-
16
-
17
-
18
-
19
-
20
-
21
-
22
-
23
-
24
-
25
-
26
-
27
-
28
-
29
-
30
-
31
-
32
-
33
-
34
-
35
-
36
-
37
-
38
-
39
-
 40
40 -
 41
41 -
 42
42 -
 43
43 -
 44
44 -
 45
45 -
 46
46 -
 47
47 -
 48
48 -
 49
49 -
 50
50 -
 51
51 -
 52
52 -
 53
53 -
 54
54 -
 55
55 -
 56
56 -
 57
57 -
 58
58 -
 59
59 -
 60
60 -
61
-
62
-
63
-
64
-
65
-
66
-
67
-
68
-
69
-
70
-
71
-
72
-
73
-
74
-
75
-
76
-
77
-
78
-
79
-
80
-
81
-
82
-
83
-
84
-
85
-
86
-
87
-
88
-
89
-
90
-
91
-
92
-
93
-
94
-
95
-
96
-
97
-
98
-
99
-
100
-
101
-
102
-
103
-
104
-
105
-
106
-
107
-
108
-
109
-
110
-
111
-
112
-
113
-
114
-
115
-
116
-
117
-
118
-
119
-
120
-
121
-
122
-
123
-
124
-
125
-
126
-
127
-
128
-
129
-
130
-
131
-
132
-
133
-
134
-
135
-
136
-
137
-
138
-
139
-
140
-
141
-
142
-
143
-
144
-
145
-
146
-
147
-
148
-
149
-
150
-
151
-
152
-
153
-
154
-
155
-
156
-
157
-
158
-
159
-
160
-
161
-
162
-
163
-
164
 |
 |

Experian Annual Report 2011
48
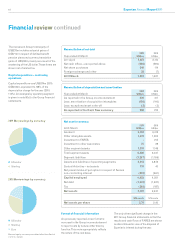
Financial review continued
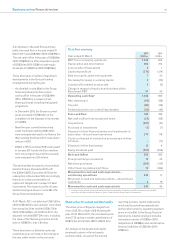
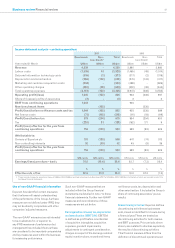
Revenue and EBIT by business segment
Year ended 31 March 2011
US$m 2010
US$m
Total
growth1
%
Organic
growth1
%
Revenue
Credit Services 1,812 1,655 7 7
Decision Analytics 435 423 4 4
Marketing Services 791 694 14 11
Interactive 1,176 1,031 14 9
Total – continuing activities 4,214 3,803 10 8
Discontinuing activities225 77 n/a
Total 4,239 3,880 8
EBIT
Credit Services 609 555 7
Decision Analytics 118 111 8
Marketing Services 126 86 47
Interactive 259 242 6
Total business segments 1,112 994 10
Central Activities (66) (62) n/a
Total – continuing activities 1,046 932 11
Discontinuing activities2(2) 3 n/a
Total 1,044 935 10
EBIT margin3
Credit Services 33.6% 33.5%
Decision Analytics 27.1% 26.2%
Marketing Services 15.9% 12.4%
Interactive 22.0% 23.5%
Total EBIT margin324.8% 24.5%
1. Growth at constant exchange rates.
2. Discontinuing activities include UK account processing, some UK hosted database activities, UK mortgage software activities and other smaller discontinuing activities.
3. EBIT margin is for continuing activities only.
4. The FARES associate is excluded from the above results as it is now classified as a discontinued operation.
out in IFRS 5, which defines a discontinued
operation as a component of an entity that
has either been disposed of, or is classified
as held for sale, and is: (i) a separate
major line of business or geographical
area of operations; (ii) part of a single plan
to dispose of a major line of business or
geographical area of operations; or (iii) a
subsidiary acquired exclusively with a view
to resale.
Continuing activities: Businesses trading at
31 March 2011 that have not been disclosed
as discontinuing activities are treated as
continuing activities.
Total growth: This is the year-on-year
change in the performance of Experian’s
activities. Total growth at constant
exchange rates removes the translational
foreign exchange effects arising on the
consolidation of Experian’s activities.
Organic growth: This is the year-on-year
change in the revenue of continuing
activities, at constant transactional and
translation exchange rates, excluding
acquisitions (other than affiliate credit
bureaux) until the first anniversary date of
consolidation.