Experian 2011 Annual Report Download - page 46
Download and view the complete annual report
Please find page 46 of the 2011 Experian annual report below. You can navigate through the pages in the report by either clicking on the pages listed below, or by using the keyword search tool below to find specific information within the annual report.-
 1
1 -
2
-
3
-
4
-
5
-
6
-
7
-
8
-
9
-
10
-
11
-
12
-
13
-
14
-
15
-
16
-
17
-
18
-
19
-
20
-
21
-
22
-
23
-
24
-
25
-
26
-
27
-
28
-
29
-
30
-
31
-
32
-
33
-
34
-
35
-
 36
36 -
 37
37 -
 38
38 -
 39
39 -
 40
40 -
 41
41 -
 42
42 -
 43
43 -
 44
44 -
 45
45 -
 46
46 -
 47
47 -
 48
48 -
 49
49 -
 50
50 -
 51
51 -
 52
52 -
 53
53 -
 54
54 -
 55
55 -
 56
56 -
57
-
58
-
59
-
60
-
61
-
62
-
63
-
64
-
65
-
66
-
67
-
68
-
69
-
70
-
71
-
72
-
73
-
74
-
75
-
76
-
77
-
78
-
79
-
80
-
81
-
82
-
83
-
84
-
85
-
86
-
87
-
88
-
89
-
90
-
91
-
92
-
93
-
94
-
95
-
96
-
97
-
98
-
99
-
100
-
101
-
102
-
103
-
104
-
105
-
106
-
107
-
108
-
109
-
110
-
111
-
112
-
113
-
114
-
115
-
116
-
117
-
118
-
119
-
120
-
121
-
122
-
123
-
124
-
125
-
126
-
127
-
128
-
129
-
130
-
131
-
132
-
133
-
134
-
135
-
136
-
137
-
138
-
139
-
140
-
141
-
142
-
143
-
144
-
145
-
146
-
147
-
148
-
149
-
150
-
151
-
152
-
153
-
154
-
155
-
156
-
157
-
158
-
159
-
160
-
161
-
162
-
163
-
164
 |
 |

Experian Annual Report 2011
44
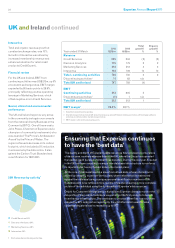
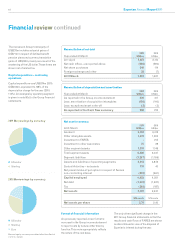
The increase in Group total equity of
US$270m includes actuarial gains of
US$77m in respect of defined benefit
pension plans and currency translation
gains of US$142m, mainly as a result of the
weakening of the US dollar. These items are
shown net of related tax.
Capital expenditure – continuing
operations
Capital expenditure was US$374m (2010:
US$314m), equivalent to 128% of the
depreciation charge for the year (2010:
114%). An analysis by operating segment
is given in note 9(b) to the Group financial
statements.
Financial review continued
Reconciliation of net debt
Year ended 31 March 2011
US$m 2010
US$m
At 1 April 1,627 2,110
Net cash inflow – as reported above (508) (590)
Net share purchases 349 114
Foreign exchange and other 33 (7)
At 31 March 1,501 1,627
Net assets summary
At 31 March 2011
US$m 2010
US$m
Goodwill 3,761 3,412
Other intangible assets 1,374 1,233
Investment in FARES -214
Investment in other associates 27 29
Other segment assets 1,318 1,149
Total segment assets 6,480 6,037
Segment liabilities (1,267) (1,165)
Assets and liabilities of operating segments 5,213 4,872
Central Activities – net assets 110 40
Net present value of put option in respect of Serasa
non-controlling interest (870) (661)
Capital employed 4,453 4,251
Net debt (1,501) (1,627)
Tax (245) (187)
Net assets 2,707 2,437
US cents US cents
Net assets per share 2.74 2.40
Reconciliation of depreciation and amortisation
Year ended 31 March 2011
US$m 2010
US$m
As reported in the Group income statement 420 417
Less: amortisation of acquisition intangibles (129) (140)
Less: exceptional asset write-off (3) (3)
As reported in the Cash flow summary 288 274
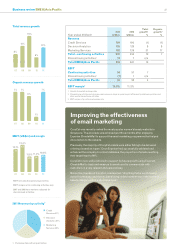
2011 Borrowings by currency
US dollar
Sterling
2010 Borrowings by currency
US dollar
Sterling
Euro
Borrowings by currency are stated after the effect of
currency swaps
Format of financial information
As previously reported, a new format is
now used in the Group income statement
to report costs by nature rather than by
function. This more appropriately reflects
the nature of the cost base.
The only other significant change in the
2011 Group financial statements is that the
results and cash flows of FARES are shown
as discontinued in view of the disposal of
Experian’s interest during the year.