Experian 2011 Annual Report Download - page 132
Download and view the complete annual report
Please find page 132 of the 2011 Experian annual report below. You can navigate through the pages in the report by either clicking on the pages listed below, or by using the keyword search tool below to find specific information within the annual report.-
 1
1 -
2
-
3
-
4
-
5
-
6
-
7
-
8
-
9
-
10
-
11
-
12
-
13
-
14
-
15
-
16
-
17
-
18
-
19
-
20
-
21
-
22
-
23
-
24
-
25
-
26
-
27
-
28
-
29
-
30
-
31
-
32
-
33
-
34
-
35
-
36
-
37
-
38
-
39
-
40
-
41
-
42
-
43
-
44
-
45
-
46
-
47
-
48
-
49
-
50
-
51
-
52
-
53
-
54
-
55
-
56
-
57
-
58
-
59
-
60
-
61
-
62
-
63
-
64
-
65
-
66
-
67
-
68
-
69
-
70
-
71
-
72
-
73
-
74
-
75
-
76
-
77
-
78
-
79
-
80
-
81
-
82
-
83
-
84
-
85
-
86
-
87
-
88
-
89
-
90
-
91
-
92
-
93
-
94
-
95
-
96
-
97
-
98
-
99
-
100
-
101
-
102
-
103
-
104
-
105
-
106
-
107
-
108
-
109
-
110
-
111
-
112
-
113
-
114
-
115
-
116
-
117
-
118
-
119
-
120
-
121
-
 122
122 -
 123
123 -
 124
124 -
 125
125 -
 126
126 -
 127
127 -
 128
128 -
 129
129 -
 130
130 -
 131
131 -
 132
132 -
 133
133 -
 134
134 -
 135
135 -
 136
136 -
 137
137 -
 138
138 -
 139
139 -
 140
140 -
 141
141 -
 142
142 -
143
-
144
-
145
-
146
-
147
-
148
-
149
-
150
-
151
-
152
-
153
-
154
-
155
-
156
-
157
-
158
-
159
-
160
-
161
-
162
-
163
-
164
 |
 |

130 Experian Annual Report 2011
Notes to the Group nancial statements continued
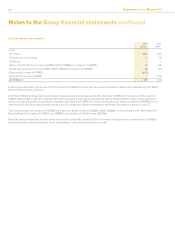
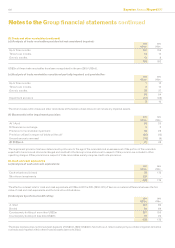
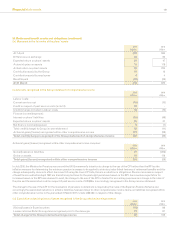
28. Loans and borrowings (continued)
(c) Analysis by currency:
2011
US$m
2010
US$m
US dollar 1,348 941
Sterling 576 561
Brazilian real 37
Euro -342
1,927 1,851
The above analysis takes account of forward foreign exchange contracts and cross currency swaps.
(d) Finance lease obligations - minimum lease payments due:
2011
US$m
2010
US$m
In less than one year 35
In one to ve years 14
Total minimum lease payments 4 9
Future nance charges -(1)
Present value of nance leases 4 8
The present value of nance leases falls due in:
Less than one year 35
Between one and ve years 13
Present value of nance leases 4 8
(e) Borrowing facilities
At 31 March 2011, the Group had undrawn committed borrowing facilities of US$1,700m, of which US$1,640m expire in December 2015 and
US$60m in March 2016. At 31 March 2010, the Group’s undrawn committed borrowing facilities were US$1,932m and these facilities were
replaced during the current year. Such facilities are for general corporate purposes, including the nancing of acquisitions.
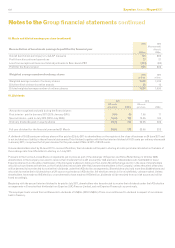
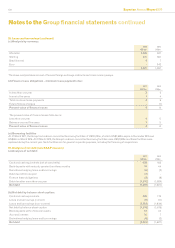
29. Analysis of net debt (non-GAAP measure)
(a) Analysis of net debt:
2011
US$m
2010
US$m
Cash and cash equivalents (net of overdrafts) 408 163
Bank deposits with maturity greater than three months 14 44
Derivatives hedging loans and borrowings (6) (2)
Debt due within one year (3) -
Finance lease obligations (4) (8)
Debt due after more than one year (1,910) (1,824)
Net debt (1,501) (1,627)
(b) Net debt by balance sheet caption:
Cash and cash equivalents 408 175
Loans and borrowings (current) (6) (17)
Loans and borrowings (non-current) (1,921) (1,834)
Net debt by balance sheet caption (1,519) (1,676)
Bank deposits within nancial assets 14 44
Accrued interest 10 7
Derivatives hedging loans and borrowings (6) (2)
Net debt (1,501) (1,627)